How to Optimize Your Videos Through YouTube Analytics Data

What if I told you there was a way to reach an audience larger than the one Netflix has through YouTube analytics?

It’s possible!

YouTube videos reach more than 2 billion users a month—about one-third of the entire internet’s traffic.

However, if you want to use YouTube videos to drive traffic and revenue, you need to deep into the data.

How do you know whether your video has impacted your business?

Through the effective use of YouTube analytics!

In the next few sections, I’ll explain what YouTube analytics is all about, how to access it, what metrics you need to track, and how to leverage this information for better ROI.

What Is YouTube Analytics?

YouTube analytics is the native analytics platform on the site, providing access to vital metrics about video performance including watch time, viewer demographics, traffic sources, impressions, and more.

What is the point of all this information?

This data is here to help you understand what type of content your audience is interested in so you can improve your YouTube strategy.

If you hate wading through data, you’ll be happy to know YouTube analytics is pretty straightforward.

Instead of overwhelming yourself with a ton of information, you can choose to focus on the data that matters most to your brand.

Why Is YouTube Analytics Important? 

Simply put, knowing about your YouTube videos’ performance levels is vital to understanding how effective your efforts have been. When you know that, you can create more of the content your viewers love.

Why does YouTube Analytics matter so much?

For starters, YouTube is the second most popular website online. Period.

Further underlining YouTube’s popularity is that teens spend much more time watching YouTube than live TV—or even Netflix or Hulu.

This fact is of particular importance if your products appeal to this demographic.

But YouTube isn’t just for teens—people of all ages and demographics watch more than a billion hours of YouTube videos every day.

How to Access YouTube Analytics

Ready to dig into the data? Here’s how to access YouTube analytics.

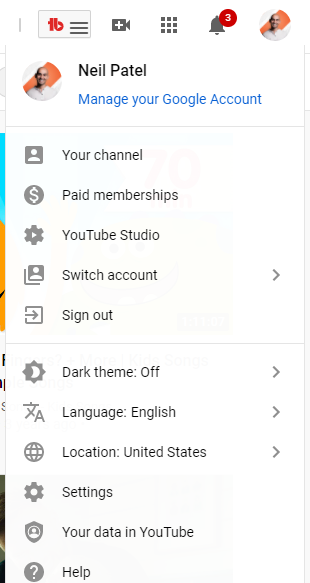
From the YouTube homepage, navigate to the top right corner, where you see your account’s avatar.

Click on the image, and you’ll see a drop-down list of account options.

Select “YouTube Studio.”
youtube analytics studio example

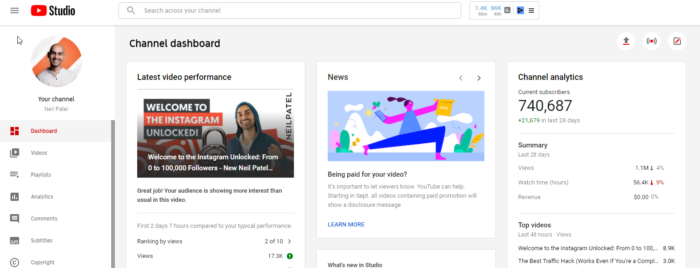
On the next page, you’ll see the Studio dashboard.

There’s a sidebar on the left, which allows you to access different parts of your account.

Click “Analytics,” which takes you to an overview of your YouTube channel’s performance.
youtube analytics channel dashboard

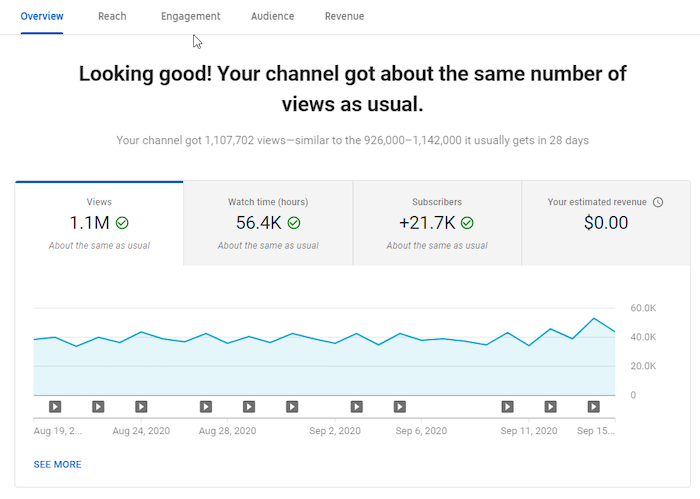
The overview page provides details like views, watch time, subscribers, estimated revenue, and real-time reporting.

You’ll also see four primary analytics tabs:

  • Reach
  • Engagement
  • Audience
  • Revenue
youtube analytics channel metrics

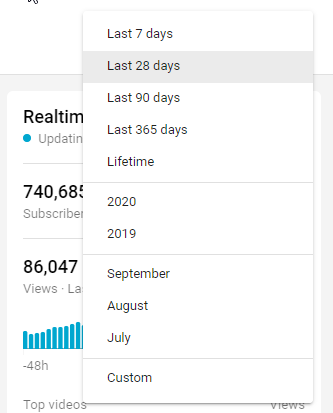
The statistics you see here are for the last 28 days. That’s YouTube’s default setting.

However, you can view metrics for a different period by clicking on the drop-down on your screen’s top right corner.
date range period youtube analytics

What if you want to see how well your videos have performed within 60 minutes or 48 hours of hitting the publish button?

The real-time report provides these details.

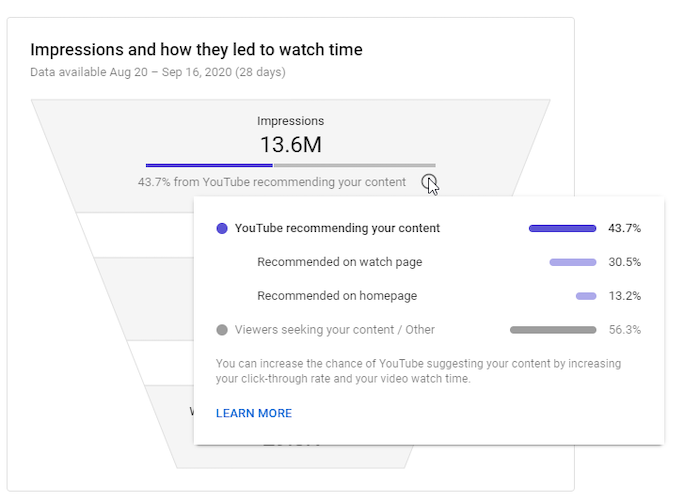
YouTube has information in place to help you understand the metrics, even if you’re a beginner.

All you have to do is hover over your chosen metric or click the “i” in a circle appearing near the metric’s name.

Here’s an example:
impressions over time youtube analytics

If you want to understand the metrics further, the “Learn More” link at the bottom of the box comes in handy.

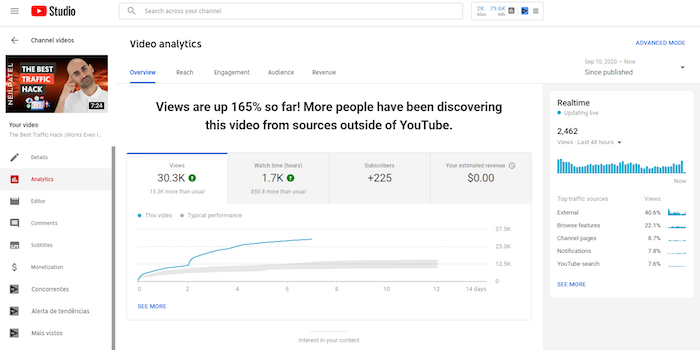
In addition to overall channel metrics, you can also view individual videos’ metrics.

To access video metrics, click on any video from the overview page.
youtube video metrics

Click on “See More” to dive deeper into the analytics of a specific video.

Alternatively, you could click “Advanced Mode” at the top right corner.

Want to see how two videos performed against each other?

The comparison feature allows you to compare two videos, one video against itself over different periods, or a video with a group of other videos.

If the video is part of a series, you can discover how it compares to the others.

Additionally, you can discover if there is a difference in seasonal video performance.

To access this feature, click “Compare to” at the top right corner of the page.
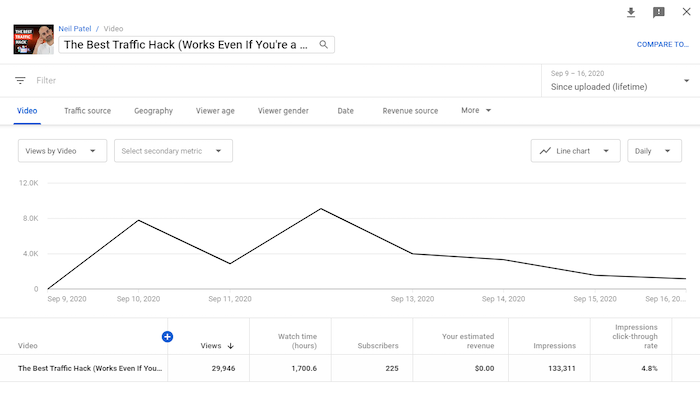
compare youtube analytics

Here, you can select the periods, video, or group to compare.
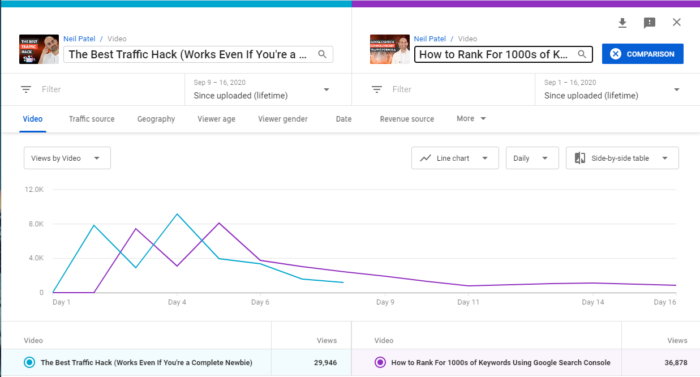
youtube analytics comparison example

Another useful option is to add filters to your metrics.

You can find the filter option beneath the video’s title in the upper left, underneath the image from your video.
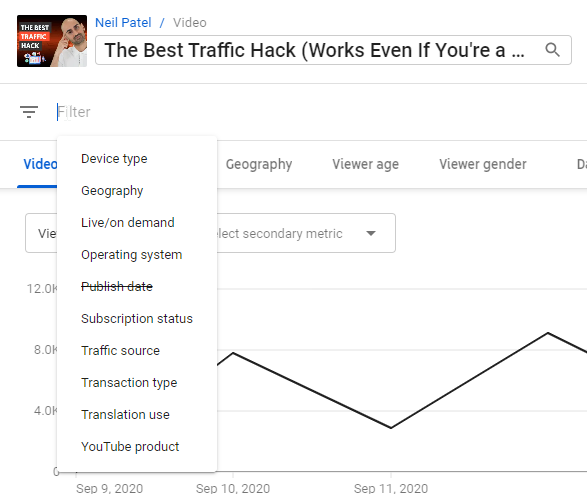
filters for youtube analytics

Clicking the “+” icon at the top of the table of metrics brings up a big list of metrics you can check out.
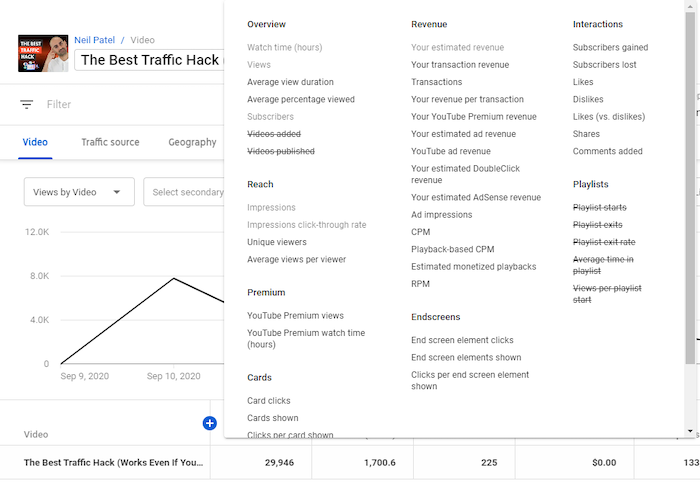
youtube analytics metrics

Want to save or share your data? You can easily export it for further analysis.

To do this, navigate to the top right corner of the page you want to export and click the download icon—a downward-facing arrow with a line beneath it.

export youtube analytics data

This will bring up two options—Google Sheets and .csv—so you can choose the format you prefer.

Vital Metrics to Track on YouTube Analytics

It’s easy to get lost in the sea of data on various marketing platforms. There’s so much information, and it’s understandable if you get overwhelmed by all the filters, options, and tools.

And the same applies to YouTube analytics.

Don’t worry, though: YouTube analytics is comparatively easy to use.

Keep in mind you only need to view metrics answering a specific question you have.

These questions might include:

  • How do viewers engage with our videos?
  • When do they exit the videos?
  • Which videos convert the most viewers to subscribers?
  • Do our YouTube audience demographics match with our buyer personas?

With these and more questions in mind, it should become easier to view the metrics you need.

Below, I’ll share seven essential metrics in YouTube Analytics and insights you may derive from them.

1. Demographics

When creating a video, you need to know who you’re targeting—and who’s watching.

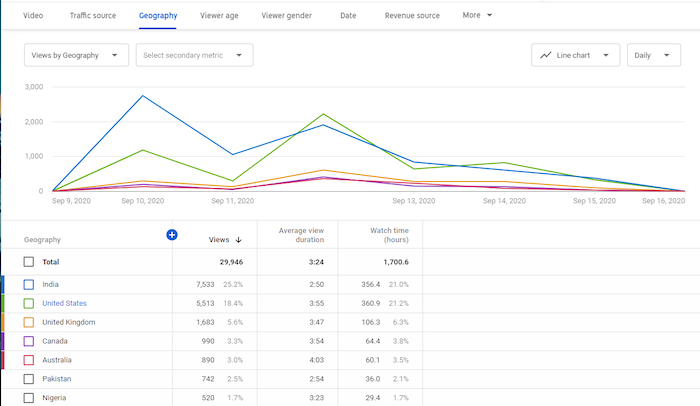
YouTube’s demographics data reveals details like the top countries and cities your viewers are watching from, viewers’ ages and genders, the times and days they most often watch videos, and more.

Location

If you have many viewers from a particular country or city, and your brand allows for this, you could tailor content to those locations. If you’re advertising a local product, but your videos aren’t generally being viewed locally, it may be time to investigate your keywords.
geography youtube analytics

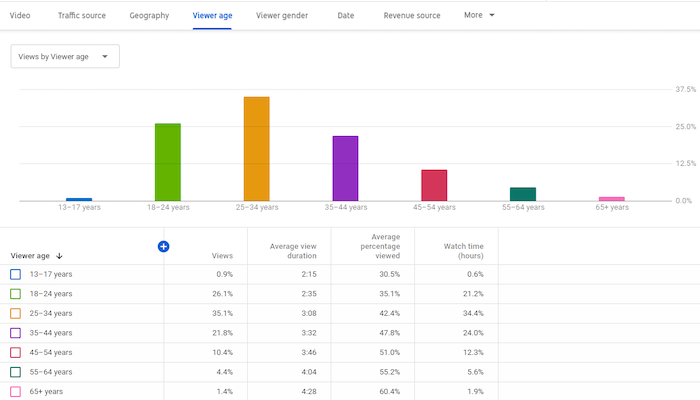
Age and Gender

Knowing who your audience is can help you create relevant and appropriate content. After all, you wouldn’t want to produce R-rated content if your viewers are typically 13-17!
youtube analytics demographics

Furthermore, the times and days viewers are on YouTube provides insights into when you should publish new videos.

If you run YouTube ads, having demographics information can also improve your ability to target content accordingly.

Finally, you can compare your demographics data to your buyer persona.

Do they match?

If so, great! If not, will you change your buyer persona or your content?

2. Traffic Source Types

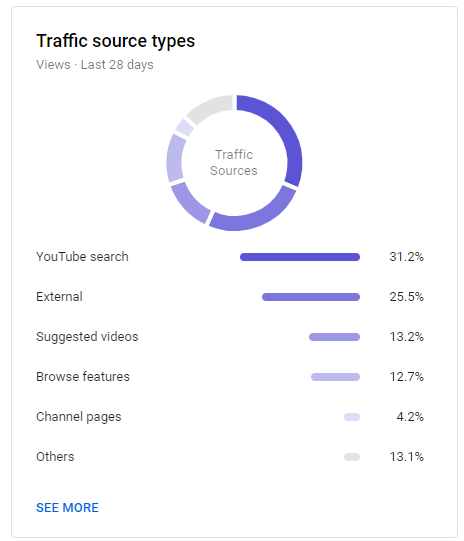
Traffic source types indicate where viewers find your videos, such as YouTube search, Suggested videos, Channel pages, direct visits, views from external sources, and others.

In addition, you’ll see how viewers from each source behave.
traffic source types youtube analytics

These metrics provide information about the sources responsible for your video views. For example, you might find your blog drives a ton of traffic to YouTube, which means you may want to embed more videos in blog posts.

For more details about how people found you, you can click on each source. For instance, clicking on “YouTube search” will show you what keywords led users to your videos.

You can also see which sources contributed little to your views and try to figure out how to boost those areas.

For example, a low number of views from YouTube search might mean you need to improve your YouTube SEO.

Or, a small number of views from Suggested videos might indicate you need to engage your audience better. Higher engagement means YouTube may see your videos as valuable and suggest them to people viewing similar content.

There are even more insights to uncover once you dig into the data.

3. Watch Time

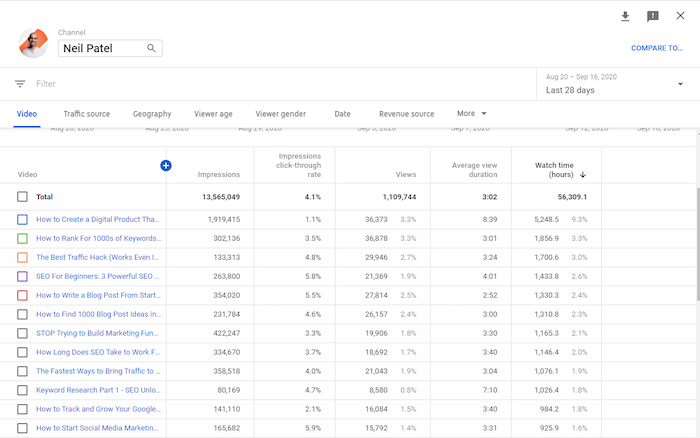
Getting a lot of YouTube views is good, but getting a high watch time is even better. “Watch time” is how long users spend watching your videos.

YouTube’s algorithm uses this metric to help it understand your content’s quality. This means a long watch time improves your chances of showing up as suggested videos and on search pages.
youtube analytics watch time

You can analyze each video’s watch time and compare it to the video’s length.

What types of videos have high watch times? What types have low watch times? Why do you think that is?

Considering the differences between videos with high and low watch times can help you create better content in the future.

You should also examine videos with a high watch time at a particular time of year. This could be a seasonal video—and if it did well, consider creating a similar video next year.  

4. Subscribers

When a viewer clicks the “Subscribe” button, they’re confirming their interest in your content. They’re then more likely to see when you post new videos—and watch them.

YouTube Analytics displays the number of subscribers you’ve gained and lost during a given period.

You’ll also see which videos contributed to your subscribers count.

Which videos are responsible for a high number of subscribers gained? Which ones are responsible for subscribers lost?

Analyzing these changes can help you improve the content you create. For example, if longer videos tend to drive more subscribers, then you should focus on longer videos

You can also view subscription sources, which tells you where subscribers found your content.  

There’s another way to understand what drives subscribers—comparing them with non-subscribers.

For example, you can compare these two audiences on metrics such as watch time, including the time spent viewing and what percentage of the video they watched.

Thirty seconds means something very different on a 45-second video than it does on a 45-minute video!
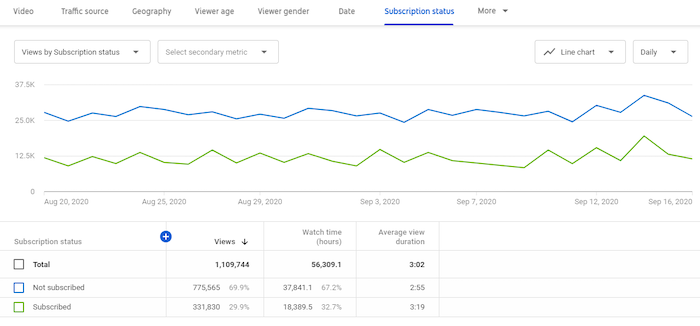
youtube analytics example

In the image above, there’s an anomaly. You see, non-subscribers are outnumbering subscribers significantly. This data indicates a need for further investigation—perhaps check their traffic sources.

5. Top Videos By End Screen

If you’ve ever watched YouTube, you know many videos end with images of other videos to watch. Those images are there to entice users to keep watching.

end screen example youtube analytics

The metric related to this tells you which end screens accounted for the most clicks.

By clicking on “See More” in the engagement tab, you’ll see details such as end screen elements shown, end screen element clicks, and clicks per end screen element.

As a result, you can identify videos that keep viewers watching.

Why is a specific end screen more effective than another? Once you figure this out, apply the insights to other videos.

6. Top Cards

Card elements are interactive and allow you to promote other YouTube videos or links to your website. You can see an example in the image below—the “Suggested” bar is a card element.

Card element metrics show you details such as card clicks, cards shown, clicks per card, and more.

From these numbers, you’ll discover which cards were most effective at converting viewers.

Ask these questions:

  • What makes these cards effective?
  • Are cards more effective on some videos than others?
  • At what time are cards most effective in a video?
  • What makes some card teasers effective?

By diving deeper into these metrics, you can find answers to these critical questions.

7. Revenue

YouTube ads are essential to revenue. However, to run YouTube ads, you need at least 1,000 subscribers and 4,000 hours of watch time. Focus on making great content using your metrics as a guide to get to these numbers.

You can see an example of an ad overlaying a YouTube video below.

youtube analytics ad revenue

If you’re running ads as part of the YouTube Partners Program already—or when you get to that point—the revenue section of analytics is crucial.

Here, you’ll find details such as your revenue sources, top-earning videos, ad types, monthly estimated revenue, YouTube Premium revenue, and more.

What are the top-earning videos? How are they different from the low earners?

You may get answers to these questions and more by diving deeply into revenue analytics.

All that said, you don’t have to monetize your channel through ads—I don’t do this myself. Instead, I use YouTube for branding, education, and to drive traffic to other resources.

Other YouTube Analytics Tools

YouTube analytics provides a ton of metrics about your channel performance, but it’s not the only source of data available.

That’s why you should use other analytics tools to gain more insight into your YouTube campaigns.

Using these tools, you can obtain analytics for other channels in your industry, enhance YouTube SEO, and get recommendations to improve.

Here are three other tools to better understand your YouTube video performance.

Vidooly

Using your YouTube analytics information, Vidooly provides suggestions about how to improve your videos.

They also grant access to video tag analysis—meaning the words in your video’s metadata—so you can discover high-performing tags.

To help you rank higher in YouTube keyword searches, Vidooly also has a keyword tool that may boost your videos’ SEO.

If you run influencer marketing campaigns, Vidooly can help you figure out which influencers may help grow your channel.

ChannelMeter

ChannelMeter provides access to extremely detailed audience insights.

Beyond that, you can monitor how videos from influencers perform. This is handy if you run YouTube influencer marketing campaigns—or if you want to emulate some of their ideas.

ChannelMeter also allows you to check on your benchmarks and follow trends among similar videos so you can adapt accordingly.

Unmetric

One of Unmetric’s most significant features is the benchmarking tools. These tools allow you to compare your strategy against your competitors.

For example, you can look at your competitor’s click-through rate, engagement rate, and video completions. This tool can help you develop campaign goals and identify new trends.

Furthermore, you can see how you fare against your competitors and obtain insights that may boost your campaigns. They even provide ideas for content creation.

Conclusion

YouTube Analytics is essential to running any successful YouTube campaign.

You can learn about your audience, what you’re doing well, and where you can improve—without being bogged down by unnecessary data, thanks to YouTube Analytics’ helpful filters.

What aspects of your videos do you think YouTube analytics can improve?

The post How to Optimize Your Videos Through YouTube Analytics Data appeared first on Neil Patel.

How to Choose The Right Analytics Agency

In our modern digitally enhanced world, data and information underpin all of our activities.  But are you making your data work for you, or is it something that you are yet to take full advantage of? For many business owners and marketers, analyzing and deploying data can be an intimidating prospect.  For that reason, analytics …

The post How to Choose The Right Analytics Agency first appeared on Online Web Store Site.

The 3 Best Analytics Companies of 2020

You likely already know how important creativity is when it comes to digital marketing.

However, coming up with great ideas – be that through content or ads – is only part of the story when it comes to driving results online. 

Another significant factor that will amplify your marketing efforts is the collection and leveraging of data.

In other words, to truly succeed with your digital marketing campaigns, you must utilize the best of the machine and human worlds. 

But perhaps you’re not a data kind of person, which is where hiring an analytics company comes into play – an option you may already be considering. 

Before you make this important decision, equip yourself with the information we’ve outlined in this article so that you can make the best choice for your needs. 

The 6 Characteristics That Make a Great Analytics Company 

When choosing the right analytics company to work with, there are certain characteristics you need to take into consideration. 

Not all agencies are built the same. It is safe to assume that most companies put their best foot forward for their clients, but there will always be variance in terms of what results you will get from each one. 

Consider the following factors.

They offer a full suite of marketing services 

You may already have your marketing strategy under control and may only need help to understand and leverage your data. 

But how can a company help you leverage your data if they have no experience in what the data should be used for? 

The point of data and analytics is to improve your decision making and inform your strategy. So, if you’re working with an agency to help you do so, they need to have some actual marketing chops. 

Make sure that the agency you want to work with offers other services besides analytics. This is a good indicator that the insights they produce from your data will actually mean something. 

They have a strong technology stack

It goes without saying, but if a company is promising to help you leverage data (technology), they will likely have the technology to do so. 

At the very minimum, your analytics partner should have their own proprietary platform that will be used as the central point for your data. 

But in the best case, the partners will leverage more advanced technologies, such as machine learning, that can help make better sense of the vast amount of data that you will have.

You will find that the best insights from your data come after the raw data is analyzed by a machine, and then made sense of by a human. 

The quality of that initial analysis, however, will depend on the quality of the technology that your agency partner has built. 

They have an all-star team 

Making sense of your marketing data is no easy task. It requires breadth and depth of skills as well as experience, all working together in a harmonious way. 

Make sure you check out the team on the about page and on LinkedIn, taking into consideration these factors:

  • Skills diversity – Making sense of data requires a symbiosis between the human and machine side of business. A good agency will have social scientists (or marketing experts), data scientists, and statisticians. 
  • Years of experience – How long has the team been operating? What are their backgrounds? The more industries and businesses they’ve seen, the higher the chance their insights will be valuable. 
  • Founders – The founders set the tone for the culture of the company. Try to find information on the background of the founder to get a better understanding of how they conduct their operations.

They have a strong roster of clients

One of the most objective ways to evaluate a company is to take a look at the clients they’ve worked with – and, most importantly, what results they’ve gotten for them.

Keep these things in mind:

  • Similar clients – If an agency mostly works with Fortune 100 clients and you’re a small startup, they probably won’t be a good fit. They likely will have their processes and expertise optimized for analyzing data at scale. 
  • Transparent results – Can the analytics agency demonstrate the results they’ve gotten in the past? 
  •  Experience with your channels – It’s no use to you if the analytics company you want to work with specializes in advertising analytics and you have a content-focused strategy. Check to see if they have demonstratable results and insights into your specific channels. 

They have a great communication style

If you’re a marketing leader or business owner, chances are you aren’t well trained in understanding and interpreting data. 

In this case, the analytics company you work with has to be able to make sense of your data and also deliver it in a way that you can actually use. 

To get an idea of this, take a look at how the company communicates with its audiences.

  • Blog posts – Is the agency creating content and educating their customers? Do they do so in a clear and simple, yet value-driven way?
  • Visualizations – Does the agency value data visualizations? Do they have any examples of how they visualize data in a user-friendly way?

They take a holistic approach to analytics

It is likely your business has a lot of data to work with. Oftentimes, insights come from unlikely places, such as comparisons between seemingly unrelated data sets. 

To get the most out of your data, your analytics agency will need to map out and architect your entire data ecosystem.

They will need to consider aspects of your business such as:

  • Customer profiles – Your customers will have data points in common, such as demographic information, which can then be used to inform PPC targeting, for instance. 
  • Marketing channels – Each marketing channel has its own set of data to be analyzed. Social media, for instance, has metrics such as engagement and likes, whereas email marketing focuses more on open rates and click-throughs. 
  • Website analytics – Your website will have metrics that can inform on everything from design to marketing. Data points such as website dwell time, page conversions, and heat map analytics come into play here. 

What To Expect From a Great Analytics Company

Each analytics company has their own unique process when working with clients.

The best analytics companies, however, will ensure their process is tailored to your specific needs.

They will also go to great lengths to ensure that you are kept in the loop as much as possible.  

Here’s what you can expect when working with a great analytics company. 

Onboarding and integration

At the beginning of your working relationship, your analytics partner should guide you through an onboarding process. 

Great onboarding sets the stage for future success, as it creates a solid foundation for your working relationship. 

  • Manage expectations – Both you and your analytics partner should clearly outline the roles and responsibilities of your relationship at the offset. Make sure you flesh out all the details, such as communication hours.
  • Integrations and set up – Depending on your marketing channels, there may be different assets your analytics partner may need to access, such as your Facebook Pixel. You will also need to be onboarded to their analytics platform.
  • Goal setting – If you haven’t already, you should have a strategy call with your partner and decide on a strategy and timeline for results. 

Auditing of processes and assets 

Before you start moving forward, the first thing your analytics partner should do is conduct an audit of your existing processes and data assets. 

Depending on your company stage, it is likely that you already have existing data that could serve as a starting point. 

  • Existing data across all channels – Your analytics agency partner will consolidate all of your data across all channels, bringing them into a single platform. 
  • Setting up tracking – In some instances, you may not have been tracking certain things. For instance, if you did not have Google Analytics installed on your site, your partner will help you set this up.
  • Problem solving – You may have attempted to leverage data and analytics before with limited effect. This could have occurred through your own means or another partner. A complete analysis of your previous attempts would need to be conducted to figure out what went wrong and how to get better results in the future.

Setting up marketing channels 

The best analytics company will be able to offer you additional marketing services such as PPC, content and SEO. 

The reason for this is simple: to better understand how to interpret the data and inform your strategy, your agency needs to have actual experience executing a marketing strategy. 

Elements of your marketing strategy that your analytics partner should help on include:

  • PPC – Performance advertising, such as Google or Facebook ads, requires a combination of analytics and creativity. Your partner will help you come up with winning ad ideas that are rooted in data. 
  • SEO – Analyzing the best keywords to target, as well as writing great pieces of content to rank in search engines, similarly reflects the importance of a holistic analytics partner. 

Data management and reporting 

Once your marketing campaigns are in full swing – and the appropriate tracking tools are in place – the fun part begins.

Now is the time to take a look at all the data you have been collecting.

If your agency partner is worth their salt, you should be looking at this data through their own proprietary software.

How this data is organized, analyzed and communicated is where you will really begin to see the difference in quality between different analytic agencies. 

  • Dashboard – When logging into your partner’s platform, you should be able to organize and navigate the different data sets for your marketing channels. 
  • Analysis – Depending on the technology used, you may be able to get instant insight into what your data means, or even compare it to other data sets in your industry.
  • Visualization – A powerful way to understand data is when it is visualized. Charts, graphs and potentially even custom infographics should be provided by your partner. 

Actionable Insights and Results 

However, collecting raw data isn’t enough. 

You need to make sense of that data so that it becomes useful.

Although your analytics partner may have sophisticated number-crunching technologies, there is still a need for a human to look over everything and create real insights.

At the end-stage of the process, your analytics partner will need to communicate to you the real meaning behind the numbers. 

  • Storytelling – Together, you will need to figure out what the data is really telling you. It is easy to point out that one advert is performing better than the other, but why? How do you find the logic behind the data?
  • Strategy – Once you really understand the data, you will need to turn those insights into a strategy. You may realize, for instance, that your entire approach has been wrong, or that there is an opportunity for a new product offering.
  • Execution –  Finally, you need to put your new data-driven strategy into action – either through your own team or with the help of your analytics partner.

The Top 3 Analytics Companies in The World 

With so many service providers to choose from, it can be difficult to narrow them down and finally choose one to go with. 

We’ve broken down the criteria that makes a great analytics company and combed through dozens of companies to find the best agencies today.

Each have their strengths and weaknesses, but regardless of whoever you choose to work with, you will be in good hands. 

#1 NP Digital – The Best for Marketing Execution

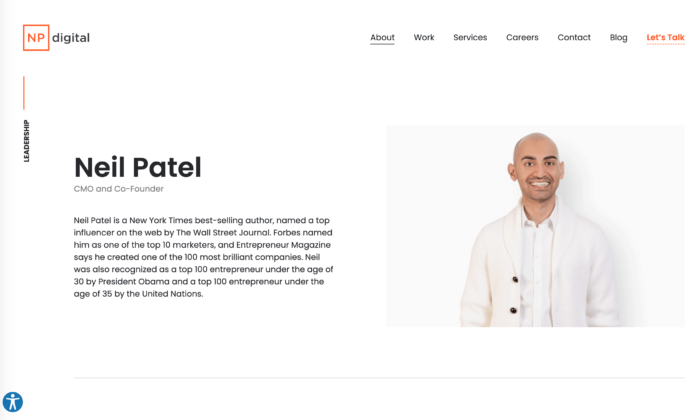
NP Digital is a marketing and analytics company founded by Neil Patel, and it is arguably the most recognizable and influential figure in the digital marketing space. 

The company was founded in 2017 and has over 44,000 followers on LinkedIn and over 100 employees. NP digital offers a full range of digital marketing services in addition to analytics.

Here’s what makes NP Digital one of the best analytic companies in 2020:

  • Founder expertise – Neil Patel is a rockstar in the digital marketing world, having started out in the space in 2001 as a teenager. The agency he founded has his fingerprints all over it, which means that you will be working with world class marketers and analysts. 
  • Marketing execution – NP Digital doesn’t just help you make sense of your data. They offer a complete suite of marketing services, from PPC to SEO. As digital marketing is the foundation of their operations, you can expect great results when combined with their analytics services. 
  • Great case studies – NP Digital often receives great reviews and has retained big clients as proof of their success. One client, for instance, has said that “NP Digital is one of the few consultant companies worth their fee”.
  • Press coverage – Neil Patel himself has been recognized by Forbes, The Wall Street Journal and the United Nations as one of the most influential marketers of our generation.
  • Education – NP Digital regularly produces educational content about all things digital marketing. This carries over to their customer relationships, where they position themselves as a teacher as opposed to just a partner.

Who should work with NP Digital?

If you need help with marketing execution in addition to data analytics, then you can’t go wrong with Neil Patel Digital. 

The company was founded by one of the most reputable figures in the digital marketing world, so when you work with his agency, you’re tapping into his years of insight.

There is, of course, a cost to this, however, so Neil Patel Digital is best suited for clients with a larger marketing budget.

Some of their clients include companies such as Viacom, Facebook and even Google.

So, if you head up a marketing team at a large organization and need an end to end marketing and analytics partner, look into Neil Patel Digital.

#2 Artefact – The Best for Technology

Artefact describes themselves as “marketing engineers” and puts particular emphasis on the technology behind digital marketing. 

In line with this identity, they have gone on to build a powerful suite of technologies, which they use to help their clients transform their data into business value. 

Artefact’s works across the entire organization to leverage data, tapping into the entire value chain of operations, IT, and marketing. 

Here’s what makes Artefact one of the best analytic companies in 2020:

  • Technology stack – Artefact utilizes some of the latest advances in AI and machine learning to create custom algorithms that help businesses accelerate data transformation and optimize their business processes. Known as their “AI Factory”, Artefact also works with cloud service providers like Azure to ensure they have a robust infrastructure. 
  • Big, diverse team – Artefact lists over 1000 employees on LinkedIn, which are composed of data scientists, software engineers, and business consultants. This allows Artefact to solve a wide range of needs across different industries. 
  • Solid case studies – Artefact has worked with clients such as FMCG to improve their digital processes. In this particular case, they received an “extremely positive response from [the] client, internal stakeholders, Amazon and even the industry and other vendors on Amazon NL”. 

Who should work with Artefact:

If you are a part of a large organization that is undergoing a digital transformation, then you should strongly consider Artefact. 

The approach and technologies that Artefact uses are also beneficial for organizations that have a lot of data that needs to be optimized across the board. 

For instance, companies that need to optimize their manufacturing processes or who need to react to market information. 

#3 Adverity – The Best for Small Businesses

In some cases, you may not want to work with an agency partner. Particularly for small businesses that don’t have large marketing budgets, analytics software can bridge the divide.

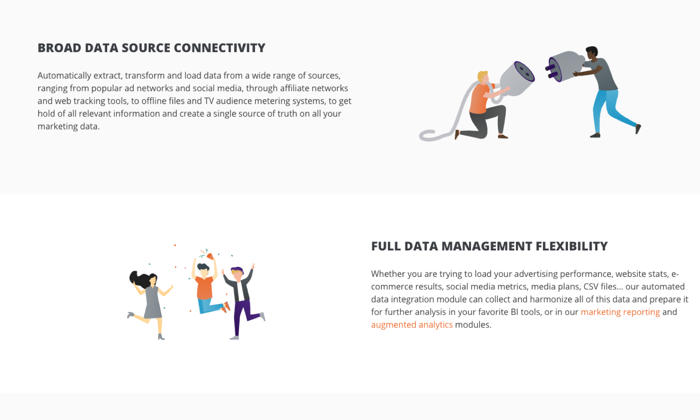
Adverity is a platform that allows you to collect all your marketing data into a single place. Their analytics tools allow you to break down silos in your organization and uncover new insights so that you can improve your decision making.

Although the Adverity team will help onboard you onto their platform, you won’t get the tailored and guided expertise that you would get from an agency such as NP Digital. 

Here’s what makes Adverity one of the best analytic companies in 2020:

  • Cost – If you want to delve into the world of analytics but don’t have a significant budget, Adverity will have you covered (to an extent). Their pricing works on a custom quote which is influenced by your industry, the size of your business, and what data sources you want to tap into. Keep in mind however that you won’t be getting the expert guidance of an agency partner like NP Digital or Artefact.
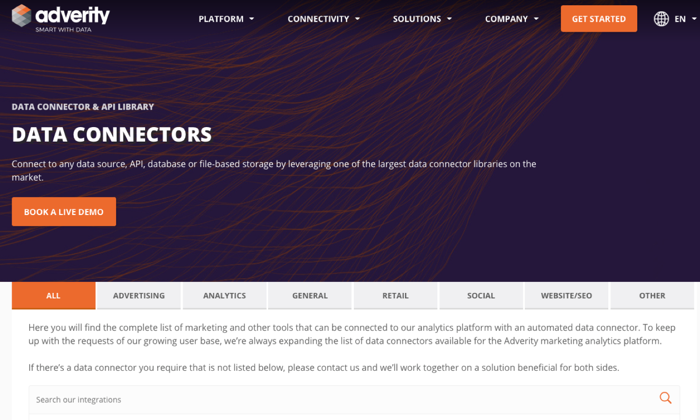
  • Holistic data analysis – Adverity has one of the largest data connector libraries on the market. You will be able to connect all of your data sources including your CRM, backend database, website analytics, and advertising. They’re always adding new integrations, so if you have a specific need they may be able to customize that for you.
  • Great reviews – On the software review platform G2, Adverity currently has a 4.5/5 star rating, with over 100 reviews. The reviews reflect a variety of businesses and use cases – from marketing agencies to political scientists. One of the most common aspects that reviewers noted is how great the connectivity of the platform is. 

Who should work with Adverity:

Adverity is best suited to small and medium-sized businesses who may not have the budget to work closely with an analytics partner. 

Keep in mind that as you will not have expert guidance, your marketing team will have to figure out how to make sense of all of your data, which is no easy task. 

Conclusion

If you leverage the research we’ve done for you in this article, you won’t have much trouble finding the right analytics company to work with. 

Regardless of your choice, remember that the goal of analytics is to inform your marketing strategy.

But data alone won’t guarantee that your digital marketing strategy will be successful. It must always be paired with creative ideas and rigorous execution. 

To ensure you can’t go wrong when picking an analytics partner, always keep the end goal of increasing conversions in mind.

The post The 3 Best Analytics Companies of 2020 appeared first on Neil Patel.
The Muse Is Hiring a Data Analyst, Business Intelligence and Analytics

Article URL: https://www.themuse.com/jobs/themuse/data-analyst-business-intelligence-analytics

Comments URL: https://news.ycombinator.com/item?id=22361157

Points: 1

# Comments: 0

The post The Muse Is Hiring a Data Analyst, Business Intelligence and Analytics appeared first on Get Funding For Your Business And Ventures.

The post The Muse Is Hiring a Data Analyst, Business Intelligence and Analytics appeared first on Buy It At A Bargain – Deals And Reviews.

7 Google Analytics Reports That Show How Your Blog is Really Performing

When you log into Google Analytics, what do you look at?

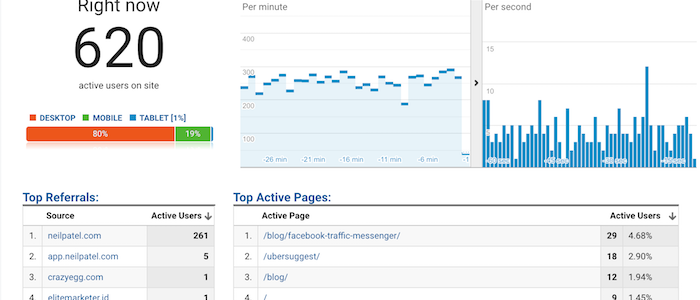
Chances are you see something like the image above that shows you how many people are currently on your blog.

Well, that was easy to guess because that’s the report Google Analytics gives you once you log in. 😉

But which reports do you look at on a regular basis?

I bet you look at two main reports…

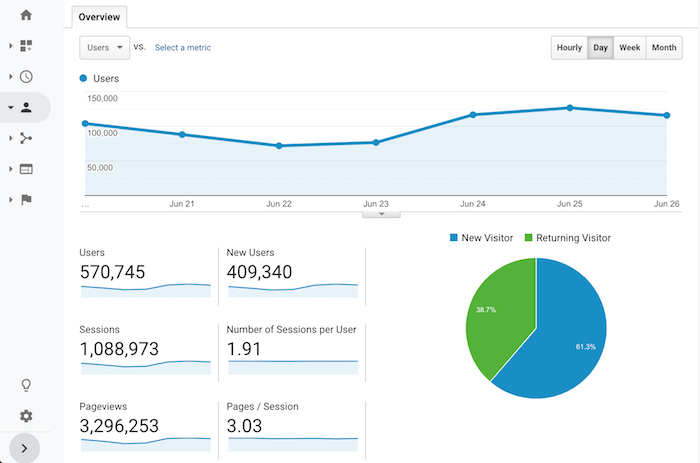
The “Audience Overview” report and the “Acquisition Overview” report.

audience overview

Sure, every once in a while, you may dive into your top pages or the specific organic keywords that drive your traffic. But even if you do that, what are you actually doing with the data?

Nothing, right?

Don’t beat yourself up over it because most content marketers just look at reports and numbers and do little to nothing with the data.

If you want to figure out how to grow your blog and, more importantly, your revenue from your blog, there are 7 reports that you need to start looking at on a regular basis.

Here they are and here is how you use them…

Report #1: Cohort Analysis

What do you think is easier to accomplish… get new visitors to your blog or getting your visitors to come back?

It’s easier to get people to come back to your blog, yet everyone focuses on new visitors.

I bet less than 99% of your blog readers turn into customers or revenue, so why not focus on getting those people back and eventually converting them?

Before we get into how to get people back to your blog, let’s look at how many people are returning to your blog.

Within the Google Analytics navigation, click on “Audience” and then “Cohort Analysis”.

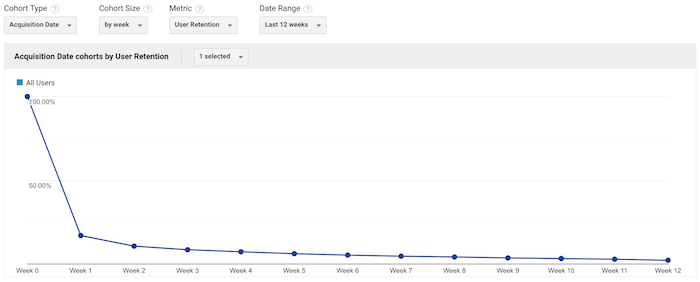
Once you land on that report, you’ll see a graph that looks similar to this:

cohort graph

Under the “Cohort Size” drop-down menu, select “by week”. Under “Date Range”, select “Last 12 weeks”.

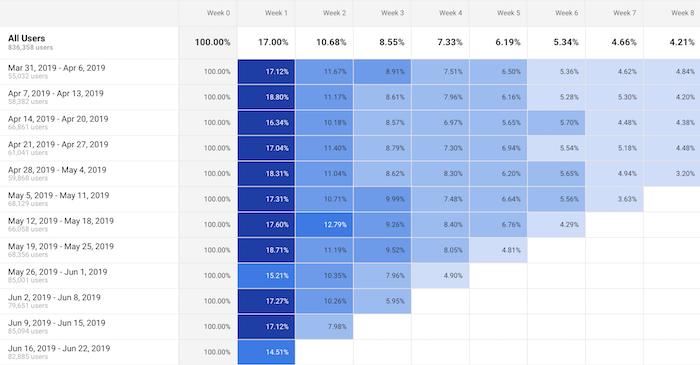
Once the data loads, you’ll see a table that looks something like this:

cohort table

What this table shows is the percentage of your visitors that come back each week.

On the very left it will always show 100%. Then in the columns to the right, you’ll see week 1, week 2, week 3, etc.

This shows the percentage of people who come back to your blog each and every week after their first visit.

For example, if this week you had 100 people visit your blog and in the week 1 column, it shows 17%. That means of the initial 100 people, 17 came back. Under week 2 if you see 8%, that means of the initial 100 people, 8 people came back in week 2.

Naturally, this number will keep getting smaller, but the goal is to get people back as often as possible. That increases trust, social shares, potential people linking to you, and it even increases the odds that the visitor will convert into a customer.

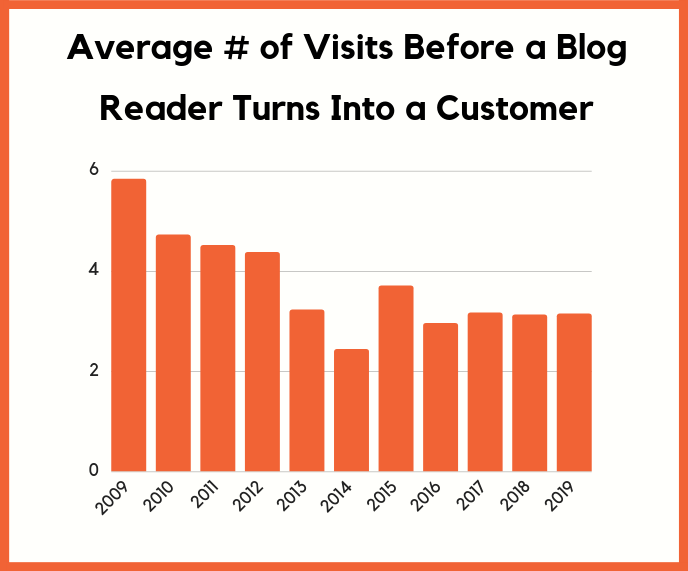
number of visits

The average blog reader needs to come back 3.15 times before they turn into a customer. That means that you need to retain readers.

Just think of it this way: If you get thousands of new people to your blog each and every single day but none of them ever come back, what do you think is going to happen to your sales?

Chances are, not much.

You need to look at your Cohort Report and continually try to improve the numbers and get people coming back.

So the real question is, how do you get people to come back?

There are 2 simple ways you can do this:

  1. Start collecting emails – through free tools like Hello Bar, you can turn your blog readers into email subscribers. Then as you publish more content, you can send an email blast and get people back to your blog.
  2. Push notifications – by using tools like Subscribers, people can subscribe to your blog through their browser. Then every time you release a new blog post, you can send out a push and people will come back to your blog.

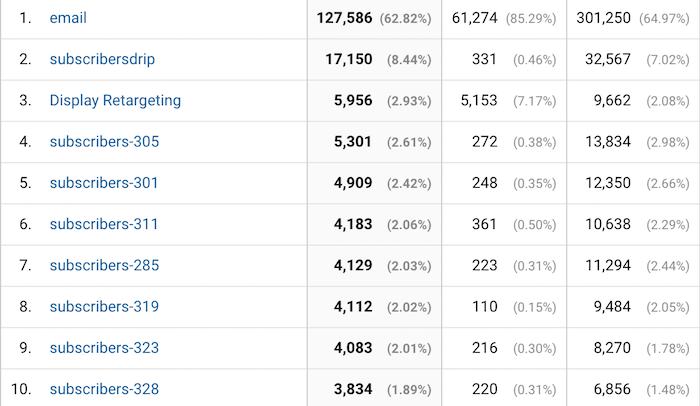
These 2 strategies are simple and they work. Just look at how many people I continually get back to my blog through emails and push notifications.

repeat visits

Report #2: Benchmarking

Ever wonder how you are doing compared to your competition?

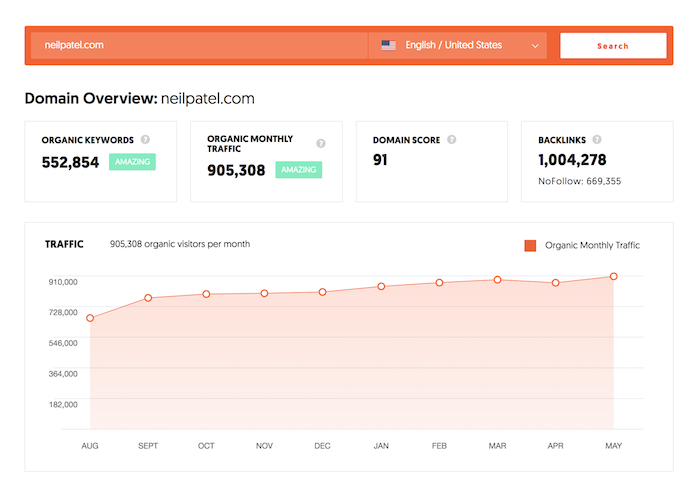
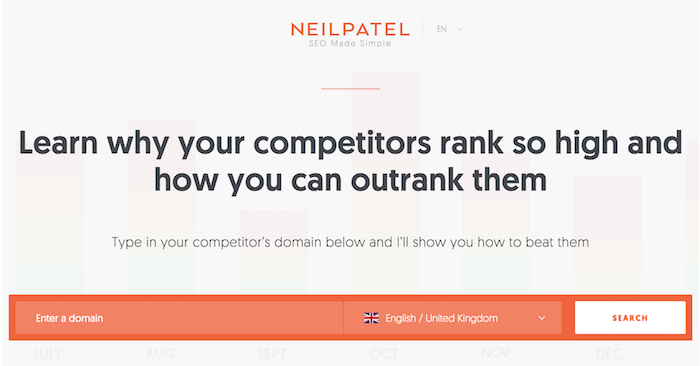
Sure, you can use tools like Ubersuggest, type in your competitors URL, and see all of the search terms they are generating traffic from.

ubersuggest neil patel

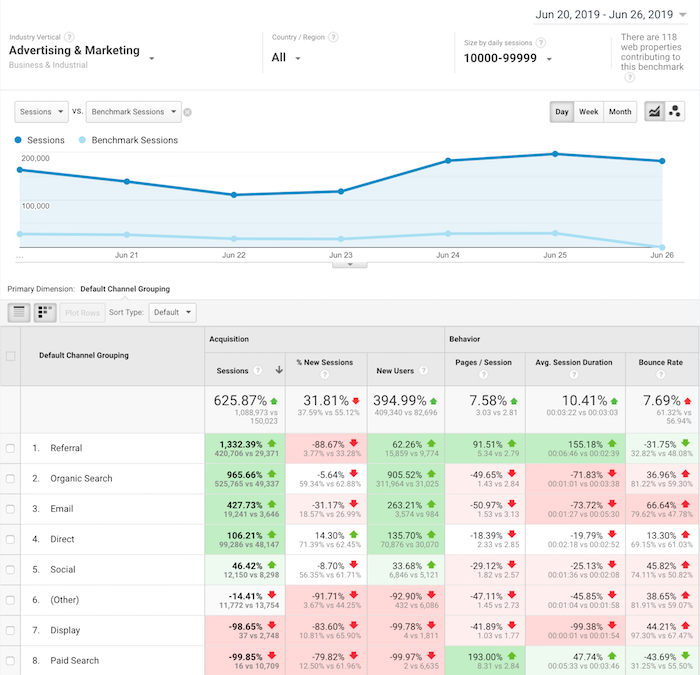
But what if you want more? Such as knowing what percentage of traffic your competitors are getting from each channel. What’s your bounce rate, average session duration, or even pageviews per channel?

bench marketing

Within Google Analytics navigation, click on “Audiences” then “Benchmarking” then “Channels”.

Once you do that, you’ll see a report that looks like the one above.

Although you won’t have specific data on a competing URL, Google Analytics will show you how you stack up to everyone else within your industry.

I love this report because it shows you where to focus your time.

If all of your competitors get way more social traffic or email traffic, it means that’s probably the lowest hanging fruit for you to go after.

On the flipside, if you have 10 times more search traffic than your competition, you’ll want to focus your efforts on where you are losing as that is what’ll probably drive your biggest gains.

The other reason you’ll want to look at the Benchmarking Report is that marketers tend to focus their efforts on channels that drive the most financial gain.

So, if all of your competition is generating the majority of their traffic from a specific channel, you can bet that channel is probably responsible for a good portion of their revenue, which means you should focus on it too.

Report #3: Location, location, location

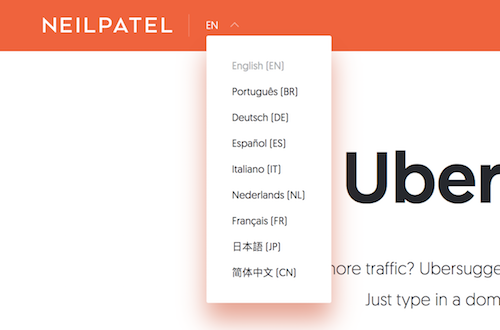
Have you noticed that my blog is available in a handful of languages?

languages

Well, there is a reason for that.

I continually look at the location report. To get to it, click on “Audience” then “Geo” and then “Location”.

location

This report will tell you where the biggest growth opportunities are for your blog.

Now with your blog, you’ll naturally see the most popular countries being the ones where their primary language is the one you use on your blog.

For example, if you write in English, then countries like the United Kingdom and the United States will be some of your top countries.

What I want you to do with this report is look at the countries that are growing in popularity but the majority of their population speak a different language than what you are blogging on.

For me, Brazil was one of those countries. Eventually, I translated my content into Portuguese and now Brazil is the second most popular region where I get traffic from.

This strategy has helped me get from 1 million visitors a month to over 4 million. If you want step-by-step instructions on how to expand your blog content internationally, follow this guide.

Report #4: Assisted conversions

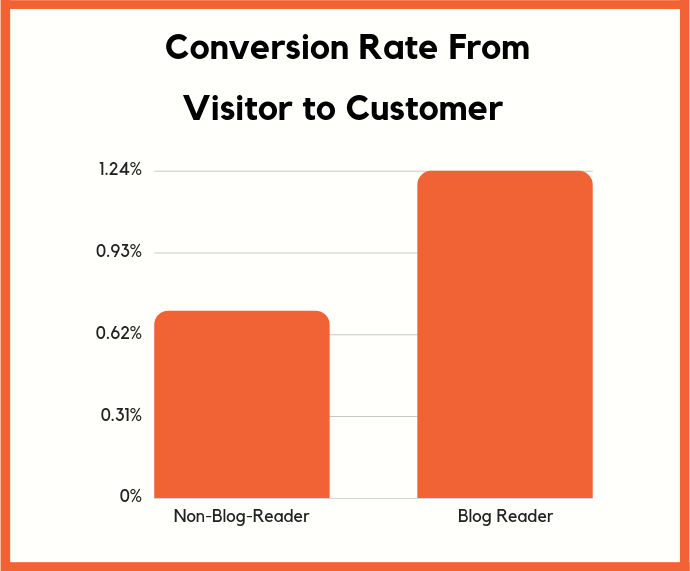
Have you heard marketers talk about how blog readers don’t convert into customers?

It’s actually the opposite.

conversions

Those visitors may not directly convert into a customer, but over time they will.

But hey, if you have a boss or you are spending your own money on content marketing, you’re not going to trust some stats and charts that you can read around the web. Especially if they only talk about long-term returns when you are spending money today.

You want hard facts. In other words, if you can’t experience it yourself, you won’t believe it.

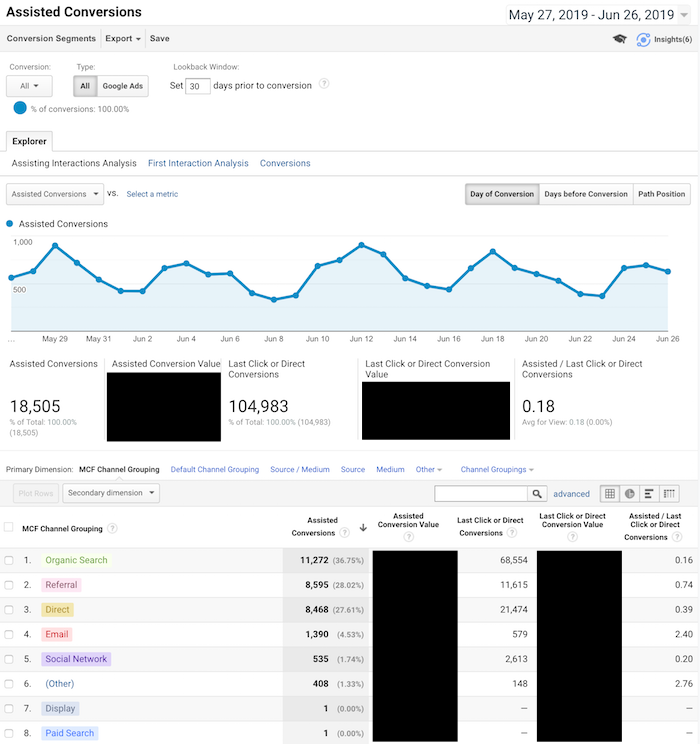
That’s why I love the Assisted Conversions Report in Google Analytics.

In the navigation bar click on “Conversions” then “Multi-Channel Funnels” and then “Assisted Conversions”.

It’ll load up a report that looks like this:

assisted conversion

This report shows you all of the channels that help drive conversions. They weren’t the final channel in which someone came from but they did visit your blog from one of these channels.

In other words, if they didn’t visit or even find your blog from one of these sources, they may not have converted at all.

Now when your boss asks you if content marketing is worth it, you can show the Assisted Conversions Report to show how much revenue your blog helps drive.

The other beautiful part about this report is that it tells you where to focus your marketing efforts. You want to focus your efforts on all channels that drive conversions, both first and last touch.

Report #5: Users flow

What’s the number one action you want your blog readers to take?

I learned this concept from Facebook. One of the ways they grew so fast is they figured out the most important action that they want people to take and then they focused most of their efforts on that.

For you, it could be someone buying a product.

For me, it’s collecting a lead and that starts with a URL.

But I found that people interact with my blog differently based on the country they are coming from.

In other words, if I show the same page to a United States visitor and from someone in India or even the United Kingdom, they interact differently.

How did I figure that out?

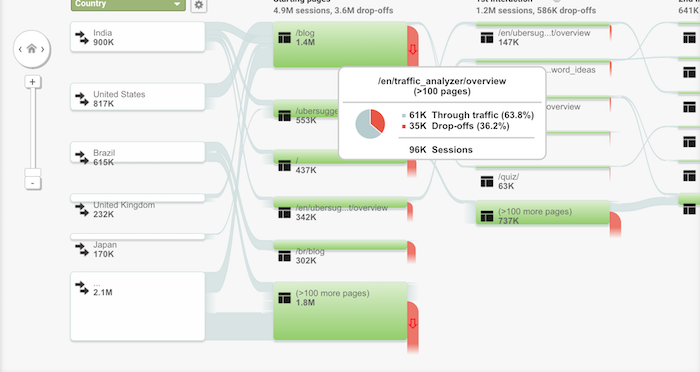
I ran some heatmap tests, but, beyond that, I used the Users Flow Report in Google Analytics.

users flow

In your navigation click on “Audience” and then “Users Flow”.

Within the report, it will break down how people from each country interact with your blog and the flow they take.

I then used it to adjust certain pages on my blog. For example, here is the homepage that people in the United States see:

us home page

And here is the homepage that people from the United Kingdom see:

uk home page

The United Kingdom homepage is much shorter and doesn’t contain as much content and that’s helped me improve my conversions there.

And of course, in the United States, my audience prefers something else, hence the homepages are different.

The Users Flow Report is a great way to see how you should adjust your site based on each geographical region.

Report #6: Device overlap

Blog content can be read anywhere and on any device. From desktop devices to tablets to even mobile phones.

The way you know you have a loyal audience isn’t just by seeing how many of your readers continually come back, but how often are they reading your blog from multiple devices.

For example, you ideally want people to read your blog from their iPhone and laptop.

The more ways you can get people to consume your content, the stronger brand loyalty you’ll build, which will increase conversion.

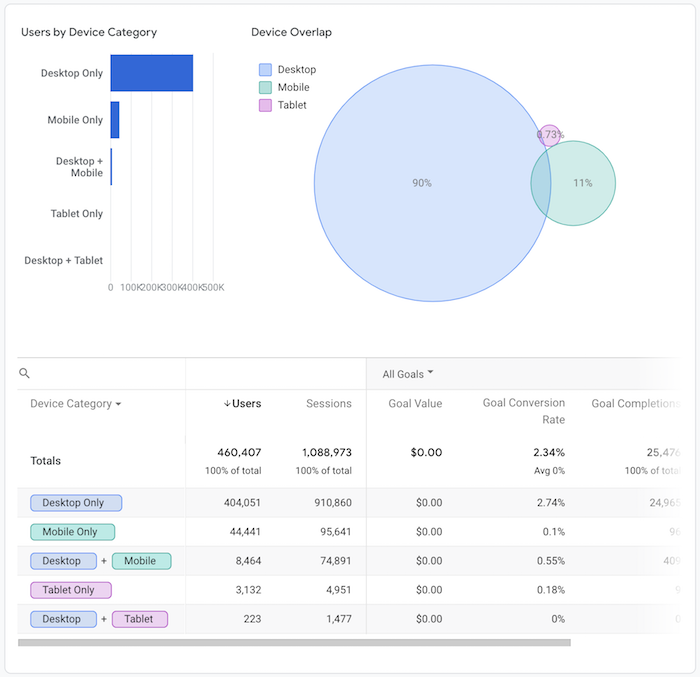
Within the navigation, click on “Audience” then “Cross Device” and then “Device Overlap”.

device overlap

I’m in the B2B sector so my mobile traffic isn’t as high as most industries but it is climbing over time.

And what I’ve been doing is continually improving my mobile load times as well as my mobile experience to improve my adoption rates.

I’m also working on a mobile app.

By doing all of these things, people can consume content from NeilPatel.com anywhere, which builds stickiness, brand loyalty, and then causes more assisted conversions.

A good rule of thumb is if you can get the overlap to be over 6%, you’ll have a very sticky audience that is much easier to convert.

That’s at least what I can see with all of the Google Analytics accounts I have access to.

Report #7: User Explorer

To really understand what makes your blog readers tick, you need to get inside their mind and figure out what their goals are and how you can help them achieve each of those goals.

A great way to do this is through the User Explorer Report.

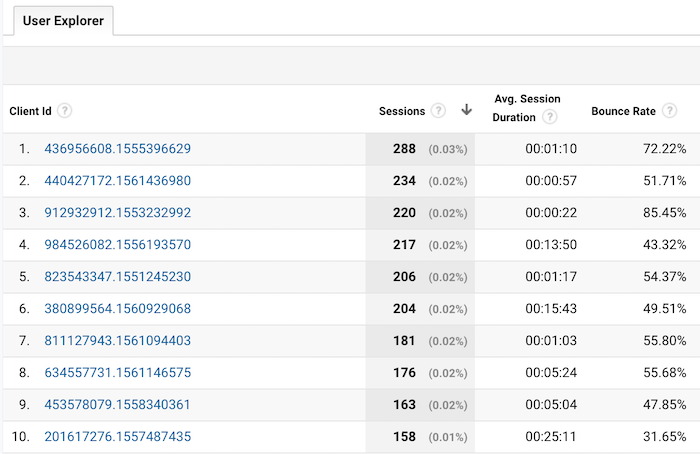
Click on “Audience” and then “User Explorer”. You’ll see a screen that looks like this:

user explorer

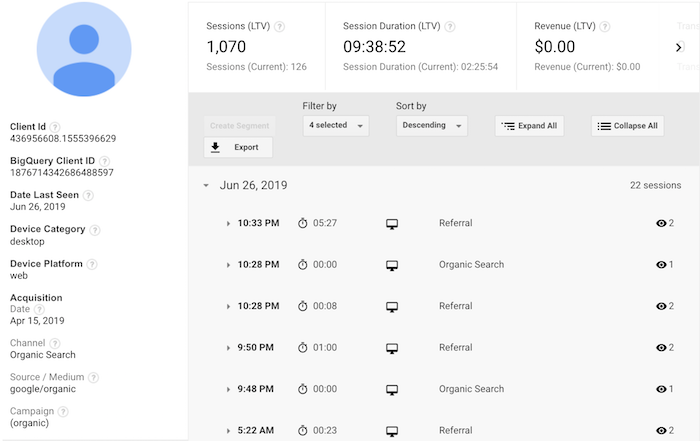
This shows you every user who visits your site and what they did. You can click on a client id to drill down and see what actions each user performed on your blog.

user explorer

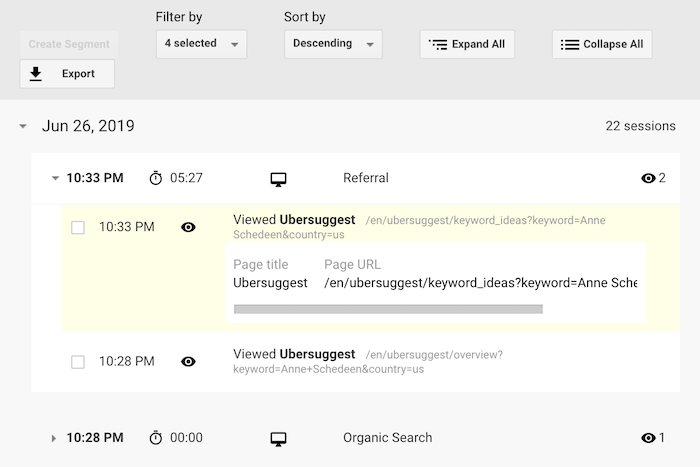
From there, you can click on a time to see exactly what they did each time they visited:

user explorer

What I like to do with this report is to see how the most popular users engage with my blog. What are they reading? What pages are they spending the majority of their time on? What makes them continually come back? How did they first learn about my blog?

By comparing the most popular blog readers with the least popular, I am typically able to find patterns. For example, my most loyal blog readers typically find my site through organic traffic and then subscribe to my email list.

Then they keep coming back, but the key is to get them to opt into my email list.

That’s why I am so aggressive with my email captures. I know some people don’t like it, but I’ve found it to work well.

So I focus a lot of my efforts on building up my organic traffic over referral traffic and then collecting emails.

Look at the patterns that get your most popular users to keep coming back and then adjust your blog flow so that you can create that pattern more often.

Conclusion

Yes, you should look at your visitor count. But staring at that number doesn’t do much.

The 7 reports I describe above, on the other hand, will help you boost your brand loyalty, your repeat visits, and your revenue.

I know it can be overwhelming, so that’s why I tried to keep it to just 7 reports. And if you can continually improve your numbers in each of those reports, your blog will continually grow and eventually thrive.

So what Google Analytics reports do you look at on a regular basis?

The post 7 Google Analytics Reports That Show How Your Blog is Really Performing appeared first on Neil Patel.