Marketing Analytics: Everything You Need to Know To Start Leveraging it Today
When’s the last time you attempted to make a recipe in the dark? I’d venture to guess you’ve never done so. It’s unnecessary and reckless. Would you be surprised to learn, then, that more than 60 percent of companies have ignored marketing analytics data when making marketing campaign decisions?
Just like making a recipe in the dark is unnecessary and reckless, so too is ignoring the invaluable marketing data when making expensive and time-consuming decisions for your business.
In this post, we’ll introduce marketing analytics and its benefits. We’ll cover the types of marketing data and how to create your own report. Finally, we’ll highlight three examples of companies that used digital marketing analytics to their advantage.
What Is Marketing Analytics?
Marketing analytics is the use of data to evaluate the performance of a marketing activity or collective marketing efforts.
From 2012 to 2020, the share of projects where marketing analytics were used to make a decision has ranged from 29 percent to 43.5 percent. While this number seems low, it does go to show that using marketing analytics to drive your own business’s campaigns will give you an edge against the competition.
Why Is Marketing Analytics Important?
Before we get into the nitty-gritty details, it helps to understand why marketing analytics is so important. While some companies may argue that analytics data isn’t crucial to their business, others will stake their success solely on their ability to follow the data.
Perhaps the greatest benefit to digital marketing analytics is the ability for businesses to understand big-picture marketing trends and forecast future results.
On a micro level, marketing analytics can help a business to understand the ROI of their individual programs. This can help them to determine which programs to cut and which programs to invest in. It will also teach them what they need to know for future projects.
Finally, consider that sophisticated marketers (those who utilize 5 or more analytics tools) are 39 percent more likely to see an overall performance improvement in their marketing programs. Just imagine what that growth could look like across your portfolio!
Types of Marketing Analytics Data
When it comes to marketing analytics data, there are three categories it can fall into. Here’s a description of each, as well as examples of the metrics used.
Descriptive Analytics
Descriptive analytics provide insights into the current state of your business. They answer the question, “what is happening now?”
The types of metrics you’ll see here are surface level. They provide a quick snapshot of the business as it is today but without any analysis or reasoning behind it. These metrics include page views, revenue, units sold, average unit price, and conversion rate.
Diagnostic Analytics
Diagnostic analytics provide a root cause as to the descriptive analytics. That is, they answer the question, “why is this happening?”
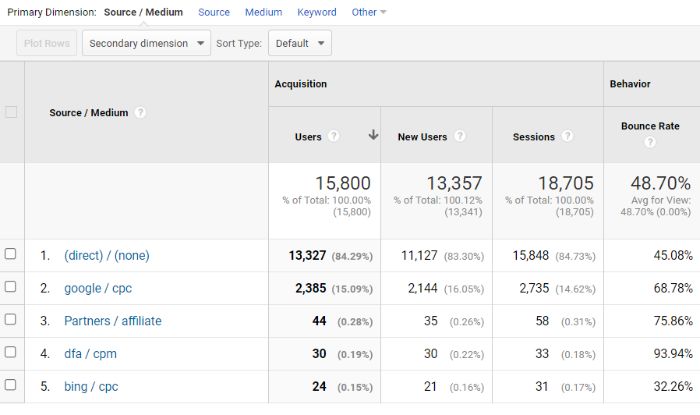
When you have questions about your descriptive metrics mentioned above, you’ll dig into the diagnostic metrics. These dig deeper to find the cause of the diagnostic metrics by looking at things such as traffic sources, bounce rates, exit rates, and last touch channels.
Predictive Analytics
Predictive analytics provide a look into the future of your business. They answer the question, “what’s likely to happen in the future based on past and current trends?”
As you can imagine, predictive analytics requires more sophisticated input. While you can pull descriptive and diagnostic analytics and make connections, you cannot do so easily with predictive analytics. Instead, you’ll typically need the help of a predictive modeling tool or a data analyst.
How to Create a Marketing Analytics Report
If you’ve been tasked with creating a digital marketing analytics report for your business, the steps below will help to get you started.
1. Pull the Raw Data
Where does it all begin? With the raw data.
How you pull your data will depend on the tools and platforms you use. There are many free and paid options available and you may find yourself using more than one to get a fuller picture.
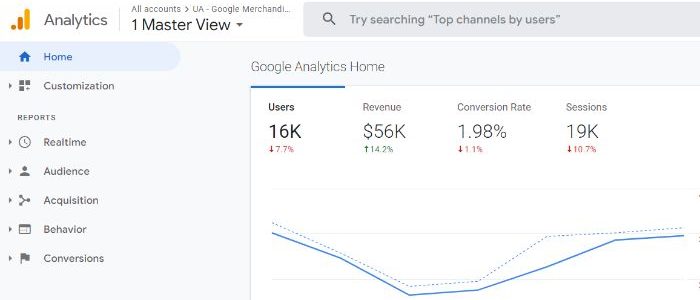
Google Analytics is a free tool that provides you with in-depth website analytics. If you’re using an e-commerce platform like Shopify, you may also have access to free analytics within your account. Paid options include HubSpot, Domo, and Tableau.
2. Understand Your Audience
There are two important questions to answer before you compile your data. They are:
- What’s the purpose of your marketing report?
- Who’s the audience for your marketing report?
To answer those questions, you’ll want to dig deeper by answering the following:
Are you pulling the data just to get a snapshot of the business, or is there something more specific in mind? Are you delivering the report to top-level executives or a direct manager? How will this data be used? How often will this data report need to be compiled?
A weekly report on the state of the business to your direct manager will look completely different than an analysis of a business unit to the CFO of the company.
3. Highlight the KPIs That Matter
You have the data and you know the purpose and audience for your report. Now it’s time to ensure you’re highlighting the right data in your report. This will come down to understanding the type of data analytics you’ll need to answer to your audience (e.g., descriptive, diagnostic, predictive).
Let’s say you’re tasked with reporting on the launch of your company’s newest product. It hit the virtual shelves two weeks ago and it’s time to evaluate its initial success. What does this look like?
Here you’ll be pulling descriptive analytics. This includes metrics like product page views, add to carts, revenue, and conversion rate.
It doesn’t end there, though, because your audience will likely want to know whythe above metrics are what they are. Whether they’re below or above the target goals, it’s good to understand what happened to get you where you are.
This means you’ll also be pulling diagnostic metrics like last touch channel and traffic source. You can also dig into the customer demographics and behaviors.
With this data, your report will begin to shape itself into more of a story than just a bunch of KPIs and graphs.
4. Use Visuals to Break Down the Data
You have the data, you know your audience, and you have your story. Now it’s time to consider the best way to tell your story to make sense to your entire audience. Visuals are a crucial way of doing so.
Visuals include graphs, charts, maps, funnels, and Venn diagrams. They are a great way to help you see your data in a new light andtell your story more effectively.
The good news is most analytics tools offer a suite of visualization tools so you don’t have to find yourself reinventing the wheel. However, programs like Microsoft Excel also make it incredibly easy to turn raw data into visualizations.
Examples of Marketing Analytics
It can be inspiring to see how other businesses are using marketing analytics to inform their decisions. Here are three examples for you to consider.
Marketing Analytics Example #1: Costa Rican Vacations
Averages are used frequently when evaluating marketing analytics. There is nothing inherently wrong with this approach, but as we’ll see below, it can be good to look at those outliers to determine the true efficacy of the average.
Looking beyond the average customer for Costa Rican Vacations has resulted in a 40 percent increase in website conversion.
According to Casey Halloran, the Co-Founder and CEO of Costa Rican Vacations, their team frequently looks to averages to inform their decisions: average spend, the average length of stay, and the average number of travelers.
Upon taking a deeper dive into the data, they realized the average number was so far off the actual customers’ metrics due to the extremes of the outliers. That is, the majority of their customers were on one end of the spectrum or the other with very few actually falling into the middle.
With this information, Costa Rican Vacations made a shift in its product offering. One way they did so was by adjusting the total budget slider on their homepage to go up to $20,000.
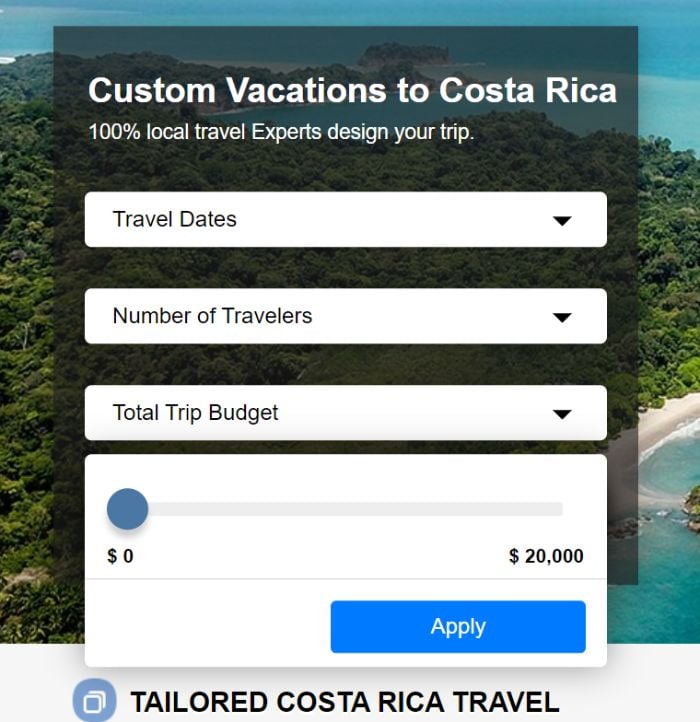
By doing so, they opened up their offering to a new, higher spending customer base and increase website conversions by 40 percent.
Other businesses, too, can benefit from this example. After all, how often do we look at averages and medians without considering the impact of our marketing decisions on the outliers? With this in mind, take time to truly understand how average your average customer really is, or whether they’re simply a product of extremes on either end.
Marketing Analytics Example #2: Allrecipes
Allrecipes is the world’s largest digital food brand. It boasts 18 websites in 23 countries and more than 85 million users. No matter how large your brand, there’s always the competition to consider. To maintain their competitive advantage, Allrecipes worked with Tableau to better understand every stage of the customer journey.
The brand had several primary objectives, including to:
- improve user experience
- increase video engagement
- drive mobile engagement
- inform product strategy
- expand user base
- grow advertising revenue
Allrecipes leveraged Tableau, a business intelligence platform to visualize data all in one place. With custom dashboards and organizational collaboration, the brand was able to achieve numerous goals. In particular, let’s look at how Tableau’s device-level analytics enabled them to drive mobile engagement.
According to Esmee Williams, the VP of Consumer and Brand Strategy, mobile usage had increased from 8 percent to three-fourths of all visits in recent years.
The goal was to increase mobile usage while also providing a continuous experience across devices. They performed an A/B test which showed the mobile site on all devices as a way to learn more about how users interacted with mobile site elements.
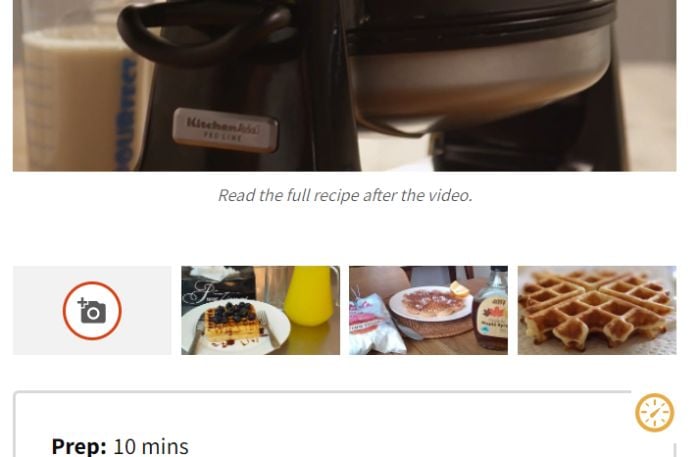
Using Tableau’s digital marketing analytics collection and visualization tools, Allrecipes used the data they collected to improve the mobile site. This included optimizing content and encouraging photo uploads with an easy-to-use interface.
While you don’t need to perform a cross-device A/B test to get these same results, your business too should evaluate mobile device engagement to understand customer behavior. Only then can you implement changes that have a measurable impact on customer engagement metrics.
Marketing Analytics Example #3: Netflix
Let’s end our examples with a titan of industry, Netflix.
Netflix has a customer retention rate of 90 percent which is far above Amazon Prime’s 75 percent and Hulu’s 64 percent. What is it that drives Netflix’s success? According to Netflix, its success is largely due to the collection and use of customer behavior analytics.
What kinds of data does Netflix collect and feed to their algorithm? Here are a few examples:
- What time and date did a user watch a show?
- What device was used to watch the show?
- If the user pauses the show, do they resume watching?
- Does the user binge-watch an entire season of a TV show?
- If they do, how much time does it take to binge-watch it?
Of course, Netflix also looks to interactions the customer has with their shows and movies. If a user selects a show based on the 96 percent recommended rate by Netflix, does the customer finish the series? Do they rate the series well?

With more than 150 million subscribers, Netflix has a large data pool from which to gather insights. This is critical to their success considering 80 percent of viewer activity is triggered by algorithmic personalized recommendations.
Marketing Analytics Frequently Asked Questions
Here are the answers to some of the most frequently asked questions about marketing analytics.
Are there additional types of marketing analytics data?
In addition to the three marketing analytics data types listed above (descriptive, diagnostic, and predictive), there are also said to be prescriptive analytics and cognitive analytics.
What are the three main components of a marketing analytics campaign?
Your digital marketing analytics campaign should be scalable, sustainable, and affordable.
What are the best marketing analytics tools on the market?
The needs of your business will largely inform your decision on marketing analytics tools. However, a few tools to consider are Tableau, Power BI, and Adobe Reporting.
Does my business need a data analyst to decipher our marketing analytics?
A data analyst can certainly offer important insights for your business. For small and medium-sized businesses, though, they likely aren’t necessary.
Marketing Analytics Conclusion
Marketing analytics is more than just a collection of data. It provides invaluable insights that could have otherwise gone unnoticed.
After all, when you’re making big decisions regarding your business’s marketing campaigns and programs, you need to evaluate all of the data available to you. Only with a proper analysis of previous data and current trends can you ensure you’re making the best decisions for your company’s bottom line.
What percent of your business’s marketing decisions are made using analytics?
