How to Optimize Your Videos Through YouTube Analytics Data

What if I told you there was a way to reach an audience larger than the one Netflix has through YouTube analytics?

It’s possible!

YouTube videos reach more than 2 billion users a month—about one-third of the entire internet’s traffic.

However, if you want to use YouTube videos to drive traffic and revenue, you need to deep into the data.

How do you know whether your video has impacted your business?

Through the effective use of YouTube analytics!

In the next few sections, I’ll explain what YouTube analytics is all about, how to access it, what metrics you need to track, and how to leverage this information for better ROI.

What Is YouTube Analytics?

YouTube analytics is the native analytics platform on the site, providing access to vital metrics about video performance including watch time, viewer demographics, traffic sources, impressions, and more.

What is the point of all this information?

This data is here to help you understand what type of content your audience is interested in so you can improve your YouTube strategy.

If you hate wading through data, you’ll be happy to know YouTube analytics is pretty straightforward.

Instead of overwhelming yourself with a ton of information, you can choose to focus on the data that matters most to your brand.

Why Is YouTube Analytics Important? 

Simply put, knowing about your YouTube videos’ performance levels is vital to understanding how effective your efforts have been. When you know that, you can create more of the content your viewers love.

Why does YouTube Analytics matter so much?

For starters, YouTube is the second most popular website online. Period.

Further underlining YouTube’s popularity is that teens spend much more time watching YouTube than live TV—or even Netflix or Hulu.

This fact is of particular importance if your products appeal to this demographic.

But YouTube isn’t just for teens—people of all ages and demographics watch more than a billion hours of YouTube videos every day.

How to Access YouTube Analytics

Ready to dig into the data? Here’s how to access YouTube analytics.

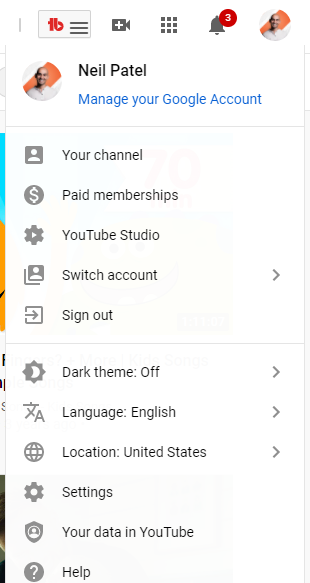
From the YouTube homepage, navigate to the top right corner, where you see your account’s avatar.

Click on the image, and you’ll see a drop-down list of account options.

Select “YouTube Studio.”
youtube analytics studio example

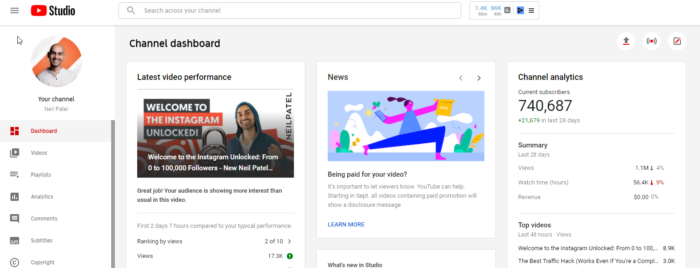
On the next page, you’ll see the Studio dashboard.

There’s a sidebar on the left, which allows you to access different parts of your account.

Click “Analytics,” which takes you to an overview of your YouTube channel’s performance.
youtube analytics channel dashboard

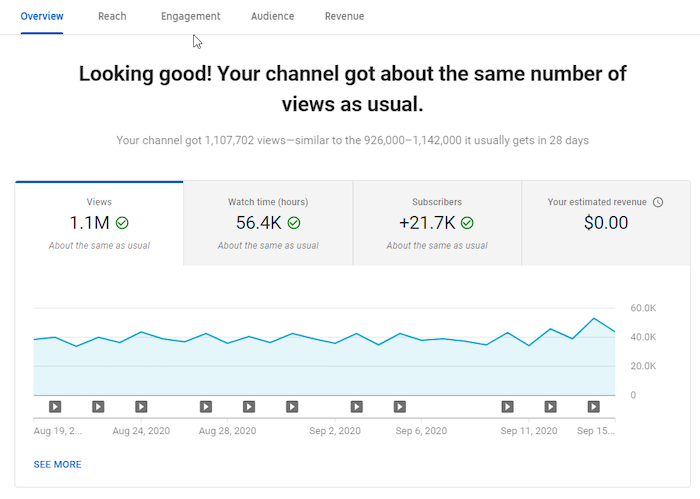
The overview page provides details like views, watch time, subscribers, estimated revenue, and real-time reporting.

You’ll also see four primary analytics tabs:

  • Reach
  • Engagement
  • Audience
  • Revenue
youtube analytics channel metrics

The statistics you see here are for the last 28 days. That’s YouTube’s default setting.

However, you can view metrics for a different period by clicking on the drop-down on your screen’s top right corner.
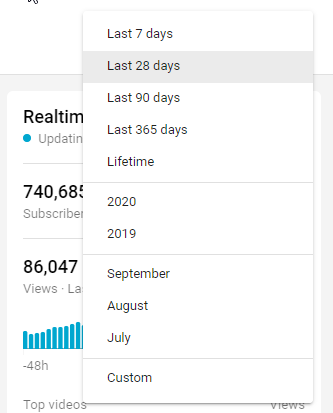
date range period youtube analytics

What if you want to see how well your videos have performed within 60 minutes or 48 hours of hitting the publish button?

The real-time report provides these details.

YouTube has information in place to help you understand the metrics, even if you’re a beginner.

All you have to do is hover over your chosen metric or click the “i” in a circle appearing near the metric’s name.

Here’s an example:
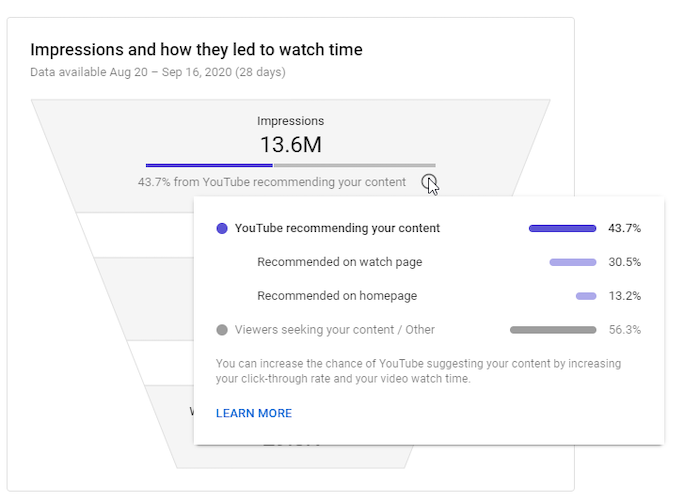
impressions over time youtube analytics

If you want to understand the metrics further, the “Learn More” link at the bottom of the box comes in handy.

In addition to overall channel metrics, you can also view individual videos’ metrics.

To access video metrics, click on any video from the overview page.
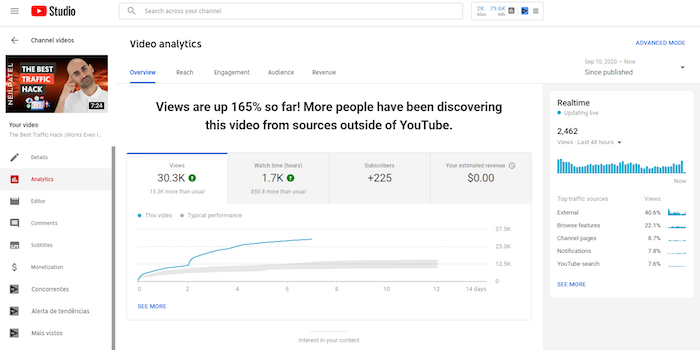
youtube video metrics

Click on “See More” to dive deeper into the analytics of a specific video.

Alternatively, you could click “Advanced Mode” at the top right corner.

Want to see how two videos performed against each other?

The comparison feature allows you to compare two videos, one video against itself over different periods, or a video with a group of other videos.

If the video is part of a series, you can discover how it compares to the others.

Additionally, you can discover if there is a difference in seasonal video performance.

To access this feature, click “Compare to” at the top right corner of the page.
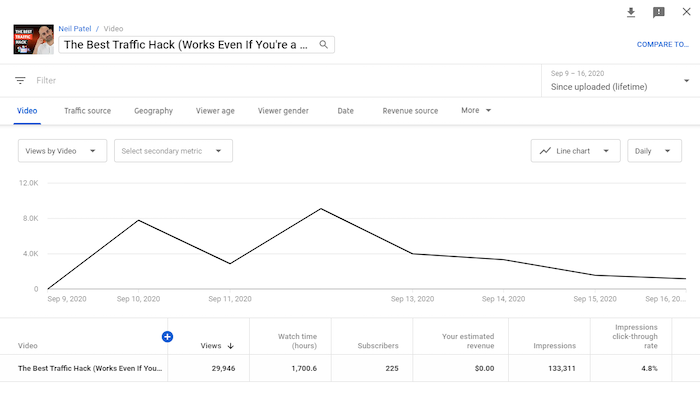
compare youtube analytics

Here, you can select the periods, video, or group to compare.
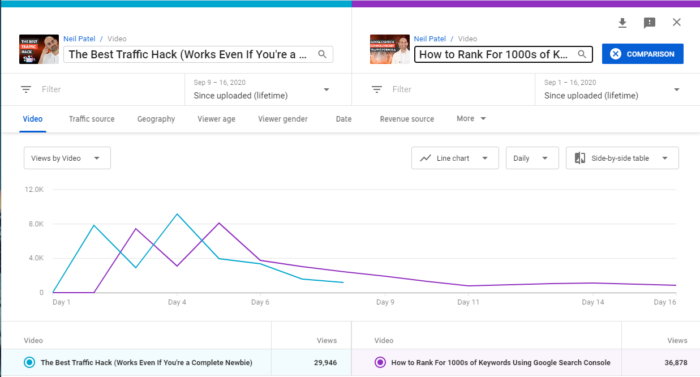
youtube analytics comparison example

Another useful option is to add filters to your metrics.

You can find the filter option beneath the video’s title in the upper left, underneath the image from your video.
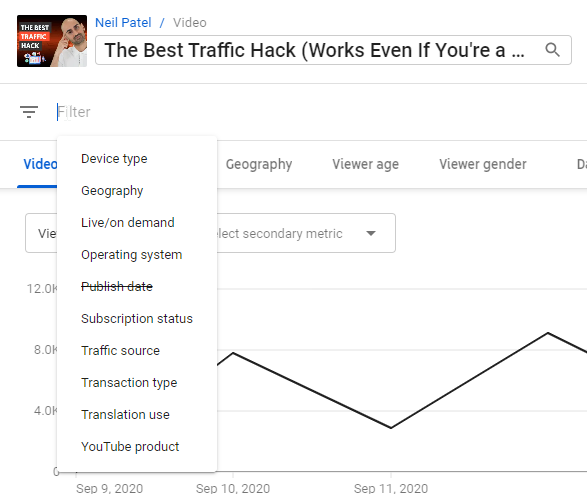
filters for youtube analytics

Clicking the “+” icon at the top of the table of metrics brings up a big list of metrics you can check out.
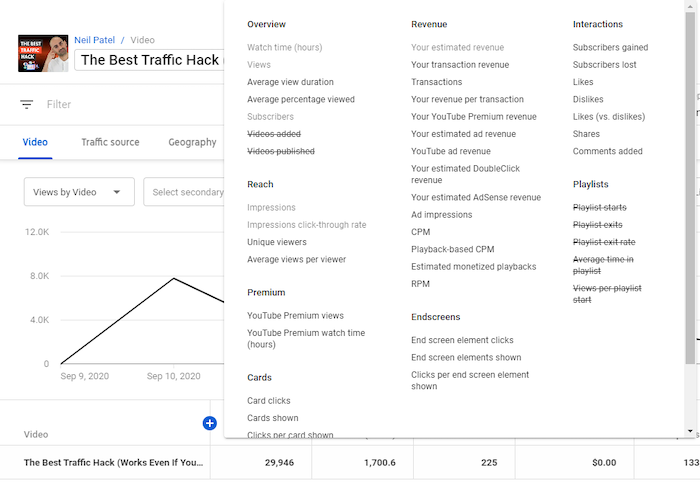
youtube analytics metrics

Want to save or share your data? You can easily export it for further analysis.

To do this, navigate to the top right corner of the page you want to export and click the download icon—a downward-facing arrow with a line beneath it.

export youtube analytics data

This will bring up two options—Google Sheets and .csv—so you can choose the format you prefer.

Vital Metrics to Track on YouTube Analytics

It’s easy to get lost in the sea of data on various marketing platforms. There’s so much information, and it’s understandable if you get overwhelmed by all the filters, options, and tools.

And the same applies to YouTube analytics.

Don’t worry, though: YouTube analytics is comparatively easy to use.

Keep in mind you only need to view metrics answering a specific question you have.

These questions might include:

  • How do viewers engage with our videos?
  • When do they exit the videos?
  • Which videos convert the most viewers to subscribers?
  • Do our YouTube audience demographics match with our buyer personas?

With these and more questions in mind, it should become easier to view the metrics you need.

Below, I’ll share seven essential metrics in YouTube Analytics and insights you may derive from them.

1. Demographics

When creating a video, you need to know who you’re targeting—and who’s watching.

YouTube’s demographics data reveals details like the top countries and cities your viewers are watching from, viewers’ ages and genders, the times and days they most often watch videos, and more.

Location

If you have many viewers from a particular country or city, and your brand allows for this, you could tailor content to those locations. If you’re advertising a local product, but your videos aren’t generally being viewed locally, it may be time to investigate your keywords.
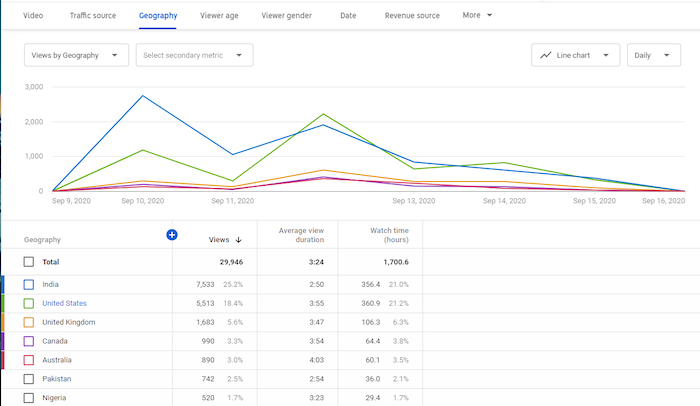
geography youtube analytics

Age and Gender

Knowing who your audience is can help you create relevant and appropriate content. After all, you wouldn’t want to produce R-rated content if your viewers are typically 13-17!
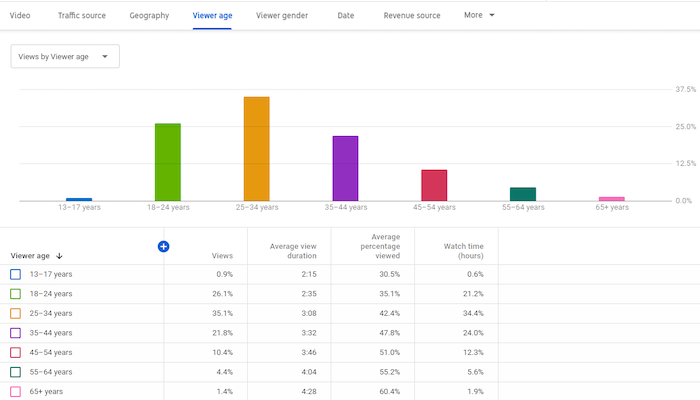
youtube analytics demographics

Furthermore, the times and days viewers are on YouTube provides insights into when you should publish new videos.

If you run YouTube ads, having demographics information can also improve your ability to target content accordingly.

Finally, you can compare your demographics data to your buyer persona.

Do they match?

If so, great! If not, will you change your buyer persona or your content?

2. Traffic Source Types

Traffic source types indicate where viewers find your videos, such as YouTube search, Suggested videos, Channel pages, direct visits, views from external sources, and others.

In addition, you’ll see how viewers from each source behave.
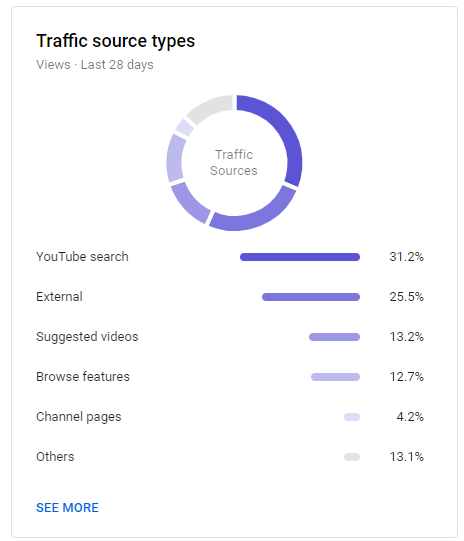
traffic source types youtube analytics

These metrics provide information about the sources responsible for your video views. For example, you might find your blog drives a ton of traffic to YouTube, which means you may want to embed more videos in blog posts.

For more details about how people found you, you can click on each source. For instance, clicking on “YouTube search” will show you what keywords led users to your videos.

You can also see which sources contributed little to your views and try to figure out how to boost those areas.

For example, a low number of views from YouTube search might mean you need to improve your YouTube SEO.

Or, a small number of views from Suggested videos might indicate you need to engage your audience better. Higher engagement means YouTube may see your videos as valuable and suggest them to people viewing similar content.

There are even more insights to uncover once you dig into the data.

3. Watch Time

Getting a lot of YouTube views is good, but getting a high watch time is even better. “Watch time” is how long users spend watching your videos.

YouTube’s algorithm uses this metric to help it understand your content’s quality. This means a long watch time improves your chances of showing up as suggested videos and on search pages.
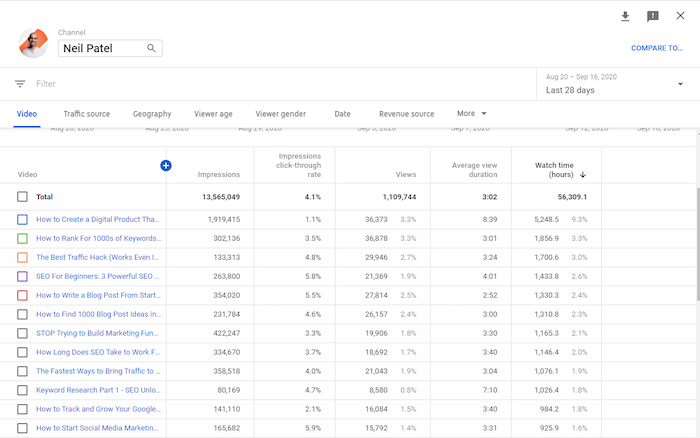
youtube analytics watch time

You can analyze each video’s watch time and compare it to the video’s length.

What types of videos have high watch times? What types have low watch times? Why do you think that is?

Considering the differences between videos with high and low watch times can help you create better content in the future.

You should also examine videos with a high watch time at a particular time of year. This could be a seasonal video—and if it did well, consider creating a similar video next year.  

4. Subscribers

When a viewer clicks the “Subscribe” button, they’re confirming their interest in your content. They’re then more likely to see when you post new videos—and watch them.

YouTube Analytics displays the number of subscribers you’ve gained and lost during a given period.

You’ll also see which videos contributed to your subscribers count.

Which videos are responsible for a high number of subscribers gained? Which ones are responsible for subscribers lost?

Analyzing these changes can help you improve the content you create. For example, if longer videos tend to drive more subscribers, then you should focus on longer videos

You can also view subscription sources, which tells you where subscribers found your content.  

There’s another way to understand what drives subscribers—comparing them with non-subscribers.

For example, you can compare these two audiences on metrics such as watch time, including the time spent viewing and what percentage of the video they watched.

Thirty seconds means something very different on a 45-second video than it does on a 45-minute video!
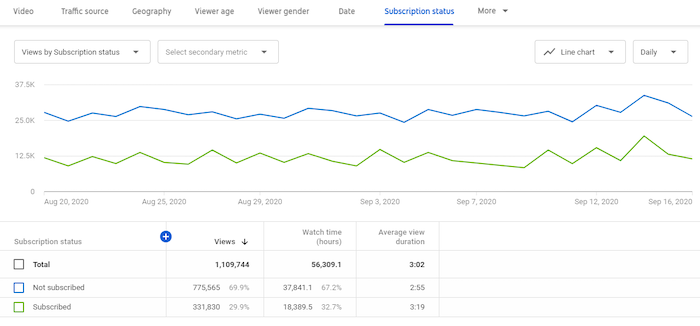
youtube analytics example

In the image above, there’s an anomaly. You see, non-subscribers are outnumbering subscribers significantly. This data indicates a need for further investigation—perhaps check their traffic sources.

5. Top Videos By End Screen

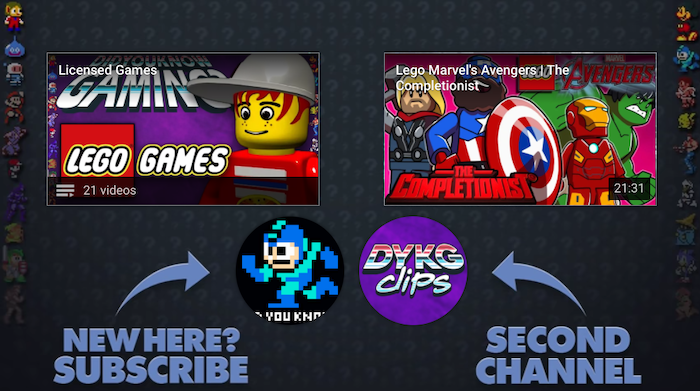
If you’ve ever watched YouTube, you know many videos end with images of other videos to watch. Those images are there to entice users to keep watching.
end screen example youtube analytics

The metric related to this tells you which end screens accounted for the most clicks.

By clicking on “See More” in the engagement tab, you’ll see details such as end screen elements shown, end screen element clicks, and clicks per end screen element.

As a result, you can identify videos that keep viewers watching.

Why is a specific end screen more effective than another? Once you figure this out, apply the insights to other videos.

6. Top Cards

Card elements are interactive and allow you to promote other YouTube videos or links to your website. You can see an example in the image below—the “Suggested” bar is a card element.

Card element metrics show you details such as card clicks, cards shown, clicks per card, and more.

From these numbers, you’ll discover which cards were most effective at converting viewers.

Ask these questions:

  • What makes these cards effective?
  • Are cards more effective on some videos than others?
  • At what time are cards most effective in a video?
  • What makes some card teasers effective?

By diving deeper into these metrics, you can find answers to these critical questions.

7. Revenue

YouTube ads are essential to revenue. However, to run YouTube ads, you need at least 1,000 subscribers and 4,000 hours of watch time. Focus on making great content using your metrics as a guide to get to these numbers.

You can see an example of an ad overlaying a YouTube video below.

youtube analytics ad revenue

If you’re running ads as part of the YouTube Partners Program already—or when you get to that point—the revenue section of analytics is crucial.

Here, you’ll find details such as your revenue sources, top-earning videos, ad types, monthly estimated revenue, YouTube Premium revenue, and more.

What are the top-earning videos? How are they different from the low earners?

You may get answers to these questions and more by diving deeply into revenue analytics.

All that said, you don’t have to monetize your channel through ads—I don’t do this myself. Instead, I use YouTube for branding, education, and to drive traffic to other resources.

Other YouTube Analytics Tools

YouTube analytics provides a ton of metrics about your channel performance, but it’s not the only source of data available.

That’s why you should use other analytics tools to gain more insight into your YouTube campaigns.

Using these tools, you can obtain analytics for other channels in your industry, enhance YouTube SEO, and get recommendations to improve.

Here are three other tools to better understand your YouTube video performance.

Vidooly

Using your YouTube analytics information, Vidooly provides suggestions about how to improve your videos.

They also grant access to video tag analysis—meaning the words in your video’s metadata—so you can discover high-performing tags.

To help you rank higher in YouTube keyword searches, Vidooly also has a keyword tool that may boost your videos’ SEO.

If you run influencer marketing campaigns, Vidooly can help you figure out which influencers may help grow your channel.

ChannelMeter

ChannelMeter provides access to extremely detailed audience insights.

Beyond that, you can monitor how videos from influencers perform. This is handy if you run YouTube influencer marketing campaigns—or if you want to emulate some of their ideas.

ChannelMeter also allows you to check on your benchmarks and follow trends among similar videos so you can adapt accordingly.

Unmetric

One of Unmetric’s most significant features is the benchmarking tools. These tools allow you to compare your strategy against your competitors.

For example, you can look at your competitor’s click-through rate, engagement rate, and video completions. This tool can help you develop campaign goals and identify new trends.

Furthermore, you can see how you fare against your competitors and obtain insights that may boost your campaigns. They even provide ideas for content creation.

Conclusion

YouTube Analytics is essential to running any successful YouTube campaign.

You can learn about your audience, what you’re doing well, and where you can improve—without being bogged down by unnecessary data, thanks to YouTube Analytics’ helpful filters.

What aspects of your videos do you think YouTube analytics can improve?

The post How to Optimize Your Videos Through YouTube Analytics Data appeared first on Neil Patel.

How to Use Events to Optimize Your Facebook And Google Ads

Your website is bustling with activity. Visitors are constantly interacting with it.

But are you taking full advantage of everything that’s happening on your website for your paid marketing? 

Every interaction a visitor has with your website… a pageview, a click… can be used to better understand your audience

And when you understand your audience you can target them in a smarter way, and get more bang for your buck from your paid campaigns on Facebook and Google.

Both Facebook and Google refer to these user interactions as Events. They allow you to track them using a tracking code installed on your website.

What Are Events?

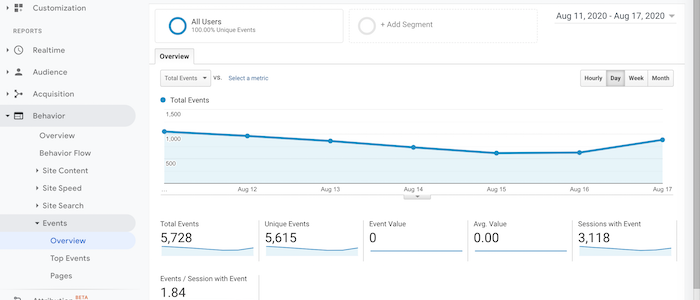
Events are user interactions that don’t involve loading another page on your website.

In e-commerce, the prime example of an event is Add to Cart.

Another event can be filling out a field in a form, as opposed to a form completion that usually triggers loading a “thank you” page. Filling out one or more fields without submission (also known form abandonment) can also be recorded as an event.

In essence, you can record any action a user makes as an event, such as watching a video, clicking on a link, or even downloading a PDF.

Why Events Are Important

Events are important because they indicate the intent of your website visitors and which ones are more likely to become a customer or a lead.

If a visitor watched a video on your website, it demonstrates an interest in your offering. 

In e-commerce, even if a visitor did not complete a purchase, an abandoned cart shows a high purchase intent. Sure, something has prevented the visitor from completing the purchase, but any visitor who got that far is worth your attention. 

By tracking events you’ll be able to make a more focused offer to these users in your paid campaigns.

How you may ask?

By injecting the events tracking data into your paid campaigns and using this data for more precise targeting and an optimized offering.

Think about it, if you can group together all the visitors who watched a certain video and set up a customized campaign for them that referenced what they saw in the video, wouldn’t that make for a far more effective campaign than a generic awareness message?

It sure will.

Let’s discuss how you can use event tracking to get more out of your ad campaigns on Facebook and Google.

How to Set Up Events on Your Website

With both Facebook and Google, you’ll need to use code for setting up events on your website.

So lets go over how you do that…

Setting Up Events Using Facebook’s Pixel

Standard events on Facebook include:

  • View content
  • Search
  • Add to cart
  • Add to wishlist
  • Initiate checkout
  • Add payment info
  • Make purchase
  • Lead
  • Complete registration

Here is the official Facebook guide for setting up events.

First, you need to verify that you already have the Facebook Pixel code embedded in the header code of every page of your website, between the <head> and </head> tags. If you don’t, first go ahead and insert the base Pixel code.

Next, select the event that you wish to track for a specific page from Facebook’s list of events. Let’s say Add to Cart event, which looks like this:

fbq(‘track’, ‘AddToCart’);

Paste the Add to Cart event code above the </script> tag.

Here’s how it should look:

Here’s what each number in the image stands for:

  1. Your header code
  2. Your base Facebook Pixel code (the ID number is unique to every website)
  3. The specific event code

You’ll need to repeat this on every page you want to track one or multiple events. Each page needs its relevant event code.

Event Tracking Setup Using Google Analytics

You can also track events in Google Analytics for even more insight. For event tracking in Google Analytics, you’ll need to create custom code snippets for every event.

Here is the official Google Analytics guide for setting up events.

The code is then added to the link code of the item or action you want to track so when the item is clicked, it will be displayed as an event in Google Analytics.

The event code is made of four elements – two required elements and two optional elements:

  • Category (required) – defines a group of actions you want to track
  • Action (required) – the type of action you want to track
  • Label (optional) – for your monitoring convenience, stating what’s the event is about
  • Value (optional) – assigning a numeric value to the event; can be monetary value, or just a scale

The basic structure of an event code looks like this:

onclick=”ga(‘send’, ‘event’, ‘Category’, ‘Action’, ‘Label’, ‘Value’);”

The code should be added within the href link code, before the link text:

<a href=”www.examplewebsite.co.uk/pdf/company_brochure.pdf” onclick=”ga(‘send’, ‘event’, ‘PDF’, ‘Download’, ‘Company Brochure – PDF Download’);“>Download Our Brochure</a>

In the example above, no Value was assigned to this event.

There Must Be a Better Way

All this event data needs to be injected into your paid campaigns in order to optimize them but before we get into that, let’s talk about the elephant in the room.

Code!

Dealing with code isn’t ideal for marketers. It’s just not our forte. 

It holds us back since constant optimization is one of the core principles of online marketing. 

And when you need your development team for every act of optimization, well, it’s not ideal.

Is there a better way to track events on your website? Yes. There’s a tool called Oribi that offers exactly that – no code event tracking. 

Oribi tracks every interaction on your website, page views, and button clicks, automatically. It collects all this data and makes it all available to you. Even when you make changes to your website, like adding a page or changing buttons, events are updated dynamically. As said, all of this is done without any code business on your behalf. 

Here’s how event tracking looks in Oribi:

The value here is apparent. You don’t need to decide which events to track, and you don’t need your development team to track it for you. Everything is tracked for you. You just need to follow the data.

Using Event Data to Optimize Your Paid Campaigns

Now you can use all this event data that you collected so diligently to better segment and optimize your paid campaigns and get more return on your ad spend.

There are two main objectives for tracking event data:

  1. Internal – being able to analyze how visitors are interacting with your website and from that optimizing the UX (user experience)
  2. External – exporting the data to your paid campaigns to better segment them – group together audiences according to their place in the funnel and specific interests in order to deliver more relevant messages

Let’s look again at the Add to Cart event. As mentioned, adding an item to a cart shows a high purchase intent. These visitors, even if didn’t complete the purchase, declared their interest in your product.

They are ‘worth your efforts’ to continue and court them in the hope they will complete a purchase in the future.

But they are all different, and you can better understand them based on the item, or items, they chose. 

If you could, for example, group together all those visitors who added a shirt and then group together those who added a pair of shoes – wouldn’t your customized paid campaigns for these two distinct groups be so much more valuable? 

You’ll be able to deliver a highly relevant message, or offering, in your ads.

This is just the tip of the iceberg as far as segmentation and optimization of your paid campaigns that can be achieved with event tracking.

Two Main Use Cases for Ad Campaign Optimization Based on Event Tracking

Both Facebook and Google offer very strong optimization capabilities for their ad campaigns.

There are two objectives for this:

  1. Ability to segment your audience in order to deliver a highly relevant message (the more segmented the audience is, the more relevant your message can be)
  2. Ability to reach new audiences that are also relevant to your offering

Let’s look at how these objectives are achieved through specific features in Facebook and Google ad campaigns.

Facebook’s Retargeting and Google’s Remarketing

The simplest way to explain the Remarketing feature is this:

When you visit a website, a tracking cookie is installed on your browser (yes, that’s the famous cookies message you now see everywhere). After you leave the website, you begin to see display ads from that website.

This is the remarketing feature: it allows advertisers to show you ads of the website you visited on other websites.

The ads can be general, just a reminder of the brand, but they also can be more personalized. The more directly related the ad is to the content you viewed, the impact it will make, thus increasing the likelihood of a purchase or return visit.

Let’s say you browsed a vacation apartments website. You looked at apartments in Lisbon, but didn’t make a reservation. A couple of days later, while scrolling down your Facebook feed, you all of a sudden see an ad that says “Still thinking about Lisbon?” 

Now that’s powerful. It will stop your scrolling. It will make you think about Lisbon again. If you clicked the ad, it would take you back straight to the Lisbon section of that vacation apartments’ website.

So by tracking events – in this case browsing a specific page – you are able to deliver highly targeted, super relevant, and hopefully mighty engaging ads to audience that already demonstrated interest in your offering.

Facebook’s Lookalike Audience and Google’s Similar Audience

The simplest way to explain the Lookalike (Similar Audience) feature is this:

Based on your audience attributes, Facebook and Google are able to target similar people and show them your ads.

Behind this simple explanation, there is a highly complex algorithm able to locate people with similar interests, demographics, location, and professional background.

Facebook and Google are able to do this thanks to the vast amounts of data they have on their users.

Let’s say you track a video as an event. The video is a top-of-the-funnel content that explains the benefits of using the app you are offering. Website visitors who watched the video are “recorded.”

You can define the visitors who watched the video as a specific “audience” in Facebook or Google Analytics. 

Then, the algorithm finds similarities between the visitors who watched the video and based on this data, can show your ads to other people who never watched the video but share the same similarities with your audience.

This is an incredible tool to expand your potential audience and reach people that are likely to be interested in your offering. This gets you more value on your ad spend.

Connecting the Dots: Events, Audience, and Targeting

So, now you know how Facebook and Google can help you refine and optimize ad campaigns, but what is the process to set it all up?

The first part of the chain is identifying the events and inserting the proper codes for all pages and types of events. We’ve already covered how to set them up, both on Facebook and Google Analytics. 

How you define an event is crucial for the success of the campaign and determines which strategy you’ll use either remarketing or a lookalike (similar) audience.

Once you have the events set up, it’s time to connect them to your ad campaign. In this context, “connect” means enabling Facebook and Google to use the data collected from the event tracking to optimize the ad campaign.

Facebook Event Tracking Ad Optimization

Let’s start with the easier of the two. 

Once you inserted the event tracking code to the various pages of your website, the events data is available for you on your Ads Manager. 

As opposed to Google, where you need to first import the event data from Google Analytics to Google Ads (we’ll get to how to do it in a sec), on Facebook this action is taken care of for you.

Still, you’ll need to locate this data. Here’s how:

First, log in to Ads Manager and click the Pixels tab…

Then, on the left, choose “data sources”, it will take you to your pixel…

Now you’ll see a general breakdown of your events…

And to give you an overview of this report, a few things you should know:

  • Events received is the total number of events recorded by the pixel
  • Top events list the highest-performing events
  • Activity shows the number of events recorded per day for the past week

Now, I want you to click on the “details button”.

Here you can see the actual breakdown of events, by volume and date. You can segment the visitors based on their actions, as we discussed before, or use the different segmentation for Lookalike audience creation.

Since you are already in Facebook Ads Manager, all the information is available for campaign targeting and optimization.

Google Analytics and AdSense Event Tracking Optimization

It’s a two-step process. First, you need to define the events in Google Analytics, and then import them into Google Ads.

Step #1: Define the event in Google Analytics

In your Analytics account, click the “Admin” tab in the bottom left corner. Then click the “Goals” tab.

Select “+New Goal”…

Choose the “Custom” option…

Name your goal…

Select “Event” option…

Now you’ll need to refer to the four elements you defined in the event code you had inserted for the specific event. This:

onclick=”ga(‘send’, ‘event’, ‘Category’, ‘Action’, ‘Label’, ‘Value’);”

The Goal you’re creating will have a specific box for each value. It looks like this:

The text you are entering here must be identical to the text in the code. If it won’t, the event won’t be recorded.

You’ll need to repeat the process above with every event you’re tracking.

Step #2: Import the event into Google Ads

In your Google Ads account, click the “Tools” tab at the top navigation bar. Select “Conversions” from the dropdown menu.

On the left side of the page, click “Google Analytics”…

You’ll see a list of all the goals you defined in Analytics…

Select the ones you want to import. Then click “Import”.

And you’re done. The events you track on your website are finally available for segmenting your remarketing campaigns and creating similar audiences.

If you don’t want to this yourself, Oribi can also do it for you.

Conclusion

Event tracking provides you with valuable data on your website visitors, such as level of intent, specific interests, and place in the funnel.

This provides better optimization of your paid ad campaigns on Facebook and Google.

You should use event data to deliver highly relevant and effective remarketing ads to segmented audiences who have already visited your website.

You should also use event data as the base for creating lookalike or similar audiences for ad campaigns targeting potential audiences who have not yet visited your website. 

By optimizing your paid ad campaigns with event data you’ll be able to better engage users, increase your conversion rate, and get more of your ad spend which results in less money for more clicks.

Have you tried event tracking to help optimize your Facebook of Google ad campaigns?

The post How to Use Events to Optimize Your Facebook And Google Ads appeared first on Neil Patel.

How to Use Events to Optimize Your Facebook And Google Ads

Your website is bustling with activity. Visitors are constantly interacting with it. But are you taking full advantage of everything that’s happening on your website for your paid marketing?  Every interaction a visitor has with your website… a pageview, a click… can be used to better understand your audience.  And when you understand your audience … Continue reading How to Use Events to Optimize Your Facebook And Google Ads