Customer Experience Analytics: Measure What Works and Make Improvements That Last
Do you want a simple way to refine your customer experience? Then look at your CX analytics.
The data doesn’t lie. It tells you what you’re doing right and what you’re doing wrong. Once you’re armed with your customer experience analytics, you gain the necessary information to offer prospects and buyers the best possible care.
When you provide a stellar customer experience, you boost efficiency and humanize your service while enhancing loyalty and recommendations.
Yet, according to a report from PWC, 54 percent of consumers feel the customer experience at many businesses needs improvement.
However, there are more benefits to examining your CX analytics.
For example, 44.5 percent of global organizations feel that an amazing CX differentiates them from competitors, and who doesn’t want to stand out and get noticed?
Now you know the importance of customer experience analytics. In this article, I explain which ones you should measure and why they’re so crucial to your business.
What Is Customer Experience Analytics?
Customer experience (CX) analytics uses customer data to improve customer interactions.
You can use the data to track customer behavior and preferences to better understand how customers interact with your company and its products or services. You can then use this information to improve the CX by changing designs, the way you market to customers, or how you deliver your products or services.
There are many different ways to collect customer data. Analytics tools for customer experience often use various data sources. However, some of the most common sources include website visits, purchase histories, contact centers, and social media data.
Benefits of Tracking Customer Experience Analytics
By understanding customer behavior and preferences, analytics for customer experience can help businesses deliver a better CX faster and more consistently. Additionally, CX analytics can contribute to a positive customer experience by identifying and resolving issues early.
Below are just some of the benefits of tracking your analytics.
Customer satisfaction tracking: Perhaps the most crucial benefit is that customer experience analytics can track customer satisfaction over time. This information enables companies to identify areas where they need to make changes to keep their customers happy.
Understanding customer interactions: By analyzing your data, customer experience analytics lets you understand how customers interact with your products/services. You can then use this information to enhance the customer experience and increase sales.
Lower customer churn: When you use them correctly, customer experience analytics improve the CX and lower churn rates by increasing retention. For example, if many customers are contacting customer service about a particular issue, you can address it. This aspect is vital because consumer demand for a positive CX is increasing. However, Zendesk says 54 percent of shoppers feel businesses see it as an afterthought.
Enhanced loyalty through targeting: Understanding customer behavior lets you create targeted marketing campaigns that are more likely to convert leads into customers and encourage loyalty.
Increased value and lower spending: Predictive customer experience analytics can identify high-value customers in terms of lifetime value and customer satisfaction. However, it also finds high value, dissatisfied customers. When this information is clear, it allows you to spend money strategically and save money. McKinsey cites one example of a company that shaved over 25 percent off its planned budget using this technique.
Metrics to Consider for Customer Experience Analytics
Customer experience analytics (CEA) is a growing field. With that in mind, it’s important to choose the right metrics and analytics tools for customer experience to measure customer CX to get the most accurate results.
While there are multiple metrics you could focus on, to keep it simple, we’re going to focus on six of the most valuable.
Let’s begin with the promoter score.
1. Promoter Score (NPS)
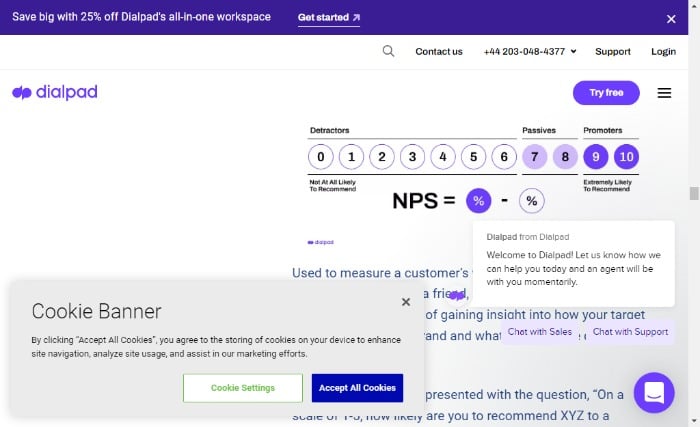
To arrive at your promoter score (NPS), you look at your customer feedback and customer loyalty.
While there are many ways to calculate NPS, the most common is to use a 1-10 scale, where 1 is very dissatisfied, and 10 is very satisfied. To get an accurate reading, it’s important to ask customers how likely they are to recommend your company on this scale.

You could also use a free calculator or a tool from this list.
The higher your NPS score is, the better your customer retention, brand awareness, and customer acquisition.
An excellent example is the jewelry company, Taylor and Hart.
They consider NPS as their most important metric. By focusing on it, breaking it down, and applying the data, the company experienced a 70 percent increase in revenue.
Although you can’t guarantee the same results, you can take the same approach as Taylor and Hart by:
- identifying your most crucial metrics and compiling the data
- organizing the data, and rating your NPS
- keep tracking your NPS and making changes
By tracking the NPS, the company:
- spotted patterns for its most popular designs
- found its top customer types, and average revenues
- identified geographical campaigns and how customers found them
- optimized their advertising
2. Customer Satisfaction Score (CSAT)
CSAT is a numeric representation of satisfied customers with a given product or service.
Many companies use customer satisfaction scores (CSAT) to track their customers’ overall happiness and identify areas where they need to make improvements.
When you track your CSAT customer experience analytics, you:
- discover unsatisfied vs. satisfied customers
- prioritize areas of your business that need improvement
- enhance your internal processes.
- guide future product development
However, despite CSAT being one of the most essential customer experience analytics, Gartner found that more than 70 percent of “CX leaders struggle to design projects that increase customer loyalty and achieve results.”
There are several different ways to collect CSAT data, but the most common way is to ask customers to rate their satisfaction on a scale from 1 to 10. You can do this through surveys, feedback forms, or chatbots. Alternatively, you can use a free calculator.
You should be aiming for a CSAT score of 75-85 percent. However, there are some variations between categories.
3. Customer Effort Score (CES)
The customer effort score (CES) metric measures how much effort a customer perceives they expend when interacting with a company.
You calculate CES by averaging the responses to questions about how much effort the customer felt they exerted during their most recent interaction with your company.
By identifying areas where customers are experiencing high levels of effort, businesses can focus on making changes to reduce the amount of work customers have to do to get what they want.
But there’s more to it.
When you get your CES right, it improves customer satisfaction, and loyalty, and lowers costs associated with handling customer complaints or support requests.
In addition, according to Gartner, when CES is high:
- NPS improves
- repurchase rates increase by up to 94 percent
- employee retention improves
Your CES score is also more accurate than understanding customer satisfaction rates.
Andrew Schumacher, Senior Principal, Advisory, Gartner, says:
“Customer effort is 40 percent more accurate at predicting customer loyalty as opposed to customer satisfaction,
Calculate your CES with this free calculator. There is no standardized CES score, but the higher the better.
4. Churn Rate
Churn rate is an essential metric for companies to track because it provides insights into why customers leave and what you can do to retain them. Most businesses focus on this metric because a high customer churn is costly and leads to lost revenue.
There are several ways to calculate customer churn rate, but the most common is to divide the number of customers who have discontinued their relationship with you by the total number of customers at the beginning of the period. This gives you a percentage of how many customers have leftover a given period.
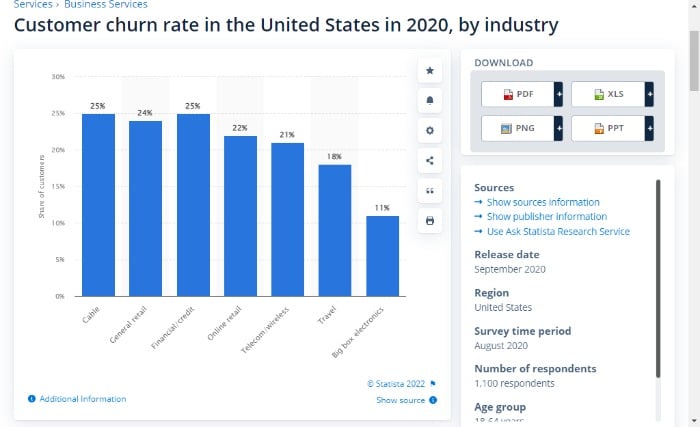
The average churn rate is 5-7 percent, while ten is high. However, it does depend on the industry. For instance, the average churn rate for online retail is 22 percent, while it’s 11 percent for big-box electronics.

You can calculate your churn rate online. If it’s high, delve into your CX analytics and look for patterns.
Remember, several factors contribute to churn rate, and businesses can take steps to reduce it by improving customer experience by tracking their CX analytics. Another way to improve customer experience is by providing an excellent support system and giving them what they want.
5. Customer Lifetime Value (CLV)
From Costco to American Express to Verizon and AT&T, they’re also using customer lifetime value as a critical metric with good reason.
CLV is a CX metric that helps business owners and CX professionals understand the value of a customer over the entire span of their relationship with their company.
It considers not just the monetary value of a customer but also how long they are likely to continue doing business with them, how much business they are likely to do moving forward, and how profitable each interaction is.
This information allows you to make strategic decisions about what types of customers to invest in acquiring and retaining, what kinds of experiences to offer them, and when it might make sense to let them go.
There is an easy-to-use online CLV calculator. For guidance, with your CLV, you are looking to make three to five times your acquisition cost.
Once you have your number, you can apply it. As a Bain & Co explain, you can use CLV to:
- segment your existing customers
- enhance conversions and ROI through better customer understanding
- create data-focused hypotheses regarding the tools needed for customer acquisition and retention
- segment new customers to target them according to limit low-value leads
- make data-focused decisions on customer prioritization, acquisition, onboarding, and retention.
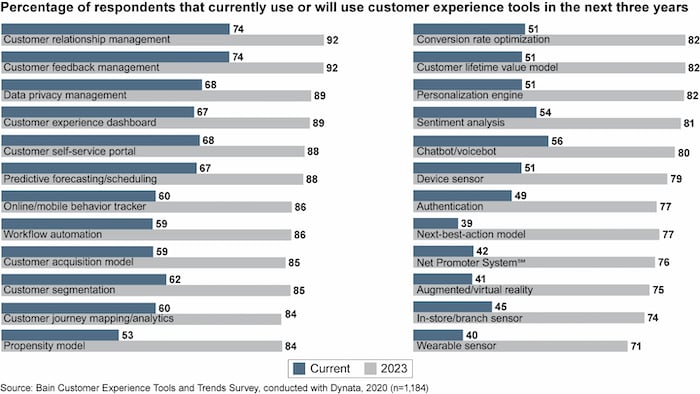
However, with your tracking, you might want to use a range of CX analytics tools, rather than focusing on one or two; research from Bain and Co shows that companies are most satisfied with results when they use a combination of tools. Further, by 2023, 92 percent expect to be using CX experience analytics tools for customer relationship management.

6. Social Media Engagement
Engagement metrics track how people interact with your brand on social media. There are many different types of engagement metrics, but some of the most common ones include clicks, likes, shares, and comments.
I can’t overemphasize the importance of tracking social media analytics. If you post something and no one clicks on it, shares it, or comments on it, you know that you need to rethink your content strategy.
The potential of social media is best explained by looking at the runaway success of TikTok. According to its stats, 44 percent of visitors visit the site every month to find something new.
TikTok also impacts every stage of the customer journey, including:
- discovery
- consideration
- purchase
Then, post-purchase, buyers head back to the site to create reviews, unboxing, tutorials, and how-tos.
The above should be enough to persuade you of the power of social media. If you’re already on sites like TikTok, Instagram, and Facebook, make sure you’re paying attention to your tracking with tools like Google Analytics, SproutSocial. and HootSuite.
Customer Experience Analytics Frequently Asked Questions
What are the types of customer experience analytics?
CX analytics come in various forms, including CES, CLV, and social media engagement. They come in a mix of categories, including marketing analytics software, and customer service analytics software, which measures the effectiveness and quality of customer service interactions. Then there are social media and web and behavioral analytics.
Can I track my customer experience metrics with free tools?
There are several free tools businesses can use to track their cx analytics. One such tool is Google Analytics. Google Analytics allows companies to track website visits, engagement, conversions, and goal completions. Another free tool is Survey Monkey. Survey Monkey allows businesses to create surveys and collect customer feedback to measure customer satisfaction and loyalty. Finally, another free tool you can use for CX analytics is Simply Measured, for social listening and analytics.
How does data analytics improve customer experience?
Data analytics can improve customer experience by helping businesses better understand their customers’ needs and preferences. Data analytics can also help companies to identify and respond to problems quickly. For example, if lots of people are complaining about a particular issue, data analytics can help businesses identify the cause of the problem and take corrective action.
Why should marketers care about customer experience analytics?
Customer experience is one of the most critical factors for businesses today. In a world where consumers have endless choices, it’s essential to provide an exceptional customer experience to stand out from the competition. Finally, studies show that improving customer experience can increase sales and revenue.
{
“@context”: “https://schema.org”,
“@type”: “FAQPage”,
“mainEntity”: [
{
“@type”: “Question”,
“name”: “What are the types of customer experience analytics?”,
“acceptedAnswer”: {
“@type”: “Answer”,
“text”: ”
CX analytics come in various forms, including CES, CLV, and social media engagement. They come in a mix of categories, including marketing analytics software, and customer service analytics software, which measures the effectiveness and quality of customer service interactions. Then there are social media and web and behavioral analytics.
”
}
}
, {
“@type”: “Question”,
“name”: “Can I track my customer experience metrics with free tools?”,
“acceptedAnswer”: {
“@type”: “Answer”,
“text”: ”
There are several free tools businesses can use to track their cx analytics. One such tool is Google Analytics. Google Analytics allows companies to track website visits, engagement, conversions, and goal completions. Another free tool is Survey Monkey. Survey Monkey allows businesses to create surveys and collect customer feedback to measure customer satisfaction and loyalty. Finally, another free tool you can use for CX analytics is Simply Measured, for social listening and analytics.
”
}
}
, {
“@type”: “Question”,
“name”: “How does data analytics improve customer experience?”,
“acceptedAnswer”: {
“@type”: “Answer”,
“text”: ”
Data analytics can improve customer experience by helping businesses better understand their customers’ needs and preferences. Data analytics can also help companies to identify and respond to problems quickly. For example, if lots of people are complaining about a particular issue, data analytics can help businesses identify the cause of the problem and take corrective action.
”
}
}
, {
“@type”: “Question”,
“name”: “Why should marketers care about customer experience analytics?”,
“acceptedAnswer”: {
“@type”: “Answer”,
“text”: ”
Customer experience is one of the most critical factors for businesses today. In a world where consumers have endless choices, it’s essential to provide an exceptional customer experience to stand out from the competition. Finally, studies show that improving customer experience can increase sales and revenue.
”
}
}
]
}
Customer Experience Analytics Conclusion
Customer experience analytics is a valuable tool for businesses. Businesses can improve customer service and make strategic decisions about their products and services by tracking customer interactions and analyzing the data.
With the right tools and data, businesses can improve their customer service and boost their bottom line.
However, you need to be measuring the correct data. Although there are several metrics you could focus on, don’t get overwhelmed.
The six metrics featured in the post are enough to get you started and give you a clearer picture of what’s going on in your business.
To further optimize your results, you can adopt a range of automation tools to enhance the overall CX experience.
Do you use customer experience analytics in your business? Which ones work best for you?
