Google Analytics (GA) is one of the most powerful tools on the web for website analysis. When properly set up and used, it allows you to break down your website traffic and gather vital information to power your digital marketing strategy. While GA has been around for some time, many people still don’t use it … Continue reading How to Navigate Google Analytics Like a Pro (Way Beyond the Basics)
Tag: Analytics
A Beginner’s Guide to Google Analytics
Are you making the most out of the data you can get about your website from Google Analytics (GA)?
The free tool gives you valuable insights into metrics like conversion rates, traffic sources, engagement, audience demographics, and more.
Let’s learn what GA is and how to use it to improve your website’s metrics.
What Is Google Analytics?
Google Analytics is a free tool to track user behavior on your website. With a range of metrics to explore, you can start to get a picture of how people use your website and how you can make changes to increase sales.
On a basic level, you can track how many visitors you have, how they found you, the number of views a page receives, and more.
In many ways, Google Analytics is the portal giving you insider, back end, and real-time access to what your users want.
Why Should You Use Google Analytics?
Google Analytics is the most powerful tool to track website metrics, and it comes from the king of search engines. On top of that, it’s free.
Although it takes some work to get set up, there are plenty of online tutorials and resources to walk you through the process. Once you get Google Analytics connected to your site, you can head to the Google Analytics dashboard and start checking things out. It can’t go back in time, though, so you will have to wait for data to gather.
Google Analytics can free you from relying on gut checks and intuition and instead tell you what pages and which content hit the mark or fall short. In this way, you can make informed choices.
The Basic Google Analytics Interface
Once you set up your Google Analytics account, you can connect different URLs and choose which one to explore from the drop-down.
The first thing Analytics shows is basic traffic data, including dates. You can alter the dates based on your needs.
On the left side of the screen, Google Analytics provides a list of report options. This is where you can start to get into the details.
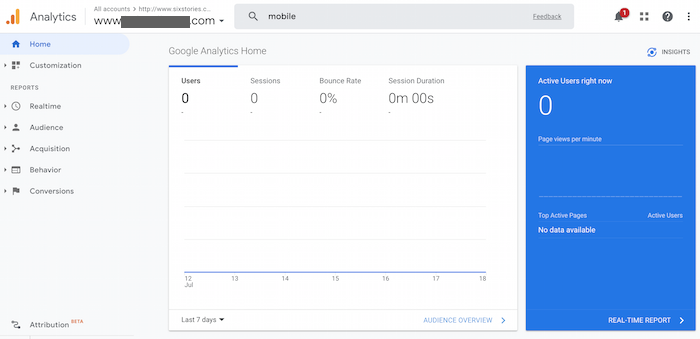
On the far right, there’s a blue box with real-time metrics showing how many people are on the site, how many pages are viewed per minute, and the most popular pages to view. You can then click on the blue box to learn more about the data.
If you’re looking for something specific, just type it into the handy search bar.
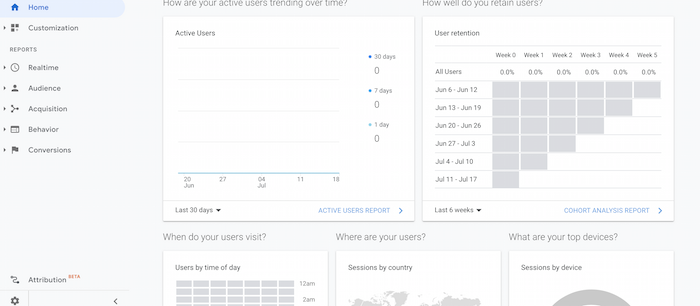
As you scroll down, you can check out different analytics, including where your users come from and what devices they use.
Common Metrics Tracked With Google Analytics
There are many metrics you can track using Google Analytics.
No matter which type you focus on, you need to choose a time frame for your data. This way, you can check a specific timespan against prior spans to see what’s changing and if what you’re doing is working.
As you analyze the data, try to remember what your marketing goals are. Otherwise, you may get overwhelmed by the whirlwind of numbers.
Let’s look at some of the most popular metrics just to get you started.
Tracking Visitors With Google Analytics
Tracking visitors shows who’s visiting, how many visitors you have, and what they’re doing on your website. This includes factors like bounce rates and session durations.
These metrics are anonymous and vague. You can’t gather personal details for specific visitors to your website.
To dig deeper, you can go to the “Audience” section of Google Analytics.
Tracking Traffic Sources With Google Analytics
Another powerful metric Google Analytics can provide is traffic sources. It answers the question, “how are people finding my website?” You can find this information under the “Acquisition” tab.
For instance, you can find out how much traffic comes from social media, Google Ads, and the Google Search Console. Knowing where your visitors are coming from and what they do once they get to your site can help you know where to focus your marketing efforts.
Tracking Content With Google Analytics
Google Analytics can help you understand how well different pieces of content perform by tracking user behavior. For example, are they visiting certain pages more often than others? Is on-page time higher on some types of content? This can help you determine what works and what doesn’t, which you can use to inform future content creation and marketing choices.
You can find this information under the “Behavior” section.
Tracking Conversions With Google Analytics
Let’s get down to brass tacks here. Are people buying (or doing whatever else you want them to do) once they land on your website? That’s what conversion metrics on Google Analytics can tell you.
These metrics are not automatically generated like the previous ones. Instead, conversion analytics requires you to set goals, typically using the pages visitors are directed to once they convert. Telling Google Analytics to follow users to these final pages can provide more specific information about how people are getting there, how many are converting, and more.
Track Mobile Performance
As mobile use becomes the norm, you may want to see how well your website performs on mobile devices.
These metrics can be found in the “Audience” section under “Mobile.” Here, you can see website metrics broken down by device categories. For example, if you find certain device users are spending less time or money on the site, look into how your site looks and behaves on that type of device.
Creating Custom Reports
As you get a handle on following your website’s metrics, you may find you need custom Google Analytics reports. Custom reports can help you check specific metrics more efficiently, using apples-to-apples comparisons between periods, campaigns, and more.
These custom reports may help when presenting information to your department, organization, leadership, or investors thanks to the hard numbers you can compare and the visual reports you can run. Of course, not everyone may fully understand what you do, but many are likely to understand the basics of what these numbers and graphs mean.
Other Common Google Analytics Functionality and Uses
Google Analytics is constantly rolling out new features that may help you meet your marketing goals. Let’s dive into a few.
Learn What People Are Searching for on Your Site
If you have a lot of content on your website, you may have a search function available to users. Knowing what people type into that search function can help you understand why visitors are on your site, allowing you to plan for and create more relevant content.
Under the “Behavior” area, click “Site Search” to view this information.
Identify Your Worst Performing Pages
Is there content on your website that’s just not performing? Then, you may benefit from optimizing those pages for SEO, deleting useless content, or creating entirely new work.
To learn which pages are not performing, go to “Behavior,” then “Site Content.” From there, click on the arrow to reorder the pages by popularity. This shows which pages get the fewest views. Do with that information what you will—though perhaps consider finding a cause before throwing the page into the abyss.
Find Where People Abandon Their Shopping Carts
People abandoning shopping carts while shopping is a typical e-commerce problem. If you can find where visitors are dropping off your website, you can make improvements to help convert them.
First, set up your goals using a sales funnel. Include each step of your check-out process, including cart, check-out, shipping, and confirmation, in the pages you plan to monitor. Then, click to “visualize your funnels” to see how people behave as they move through the funnel.
You may see a pattern regarding when people abandon carts begin to emerge and make updates accordingly.
See Your Most Important Analytics First
As we talked about above, Google Analytics places many of the most common analytics on the dashboard. However, you can set up a custom dashboard to see exactly what you need. Under the “Customization” tab, find the link for “Dashboards.” You can use a dashboard template or create your own.
How to Create Custom Reports in Google Analytics
Google Analytics makes it easy to create custom reports for your own use or presentations.
- First click on “Customization,” then click on “Custom Reports
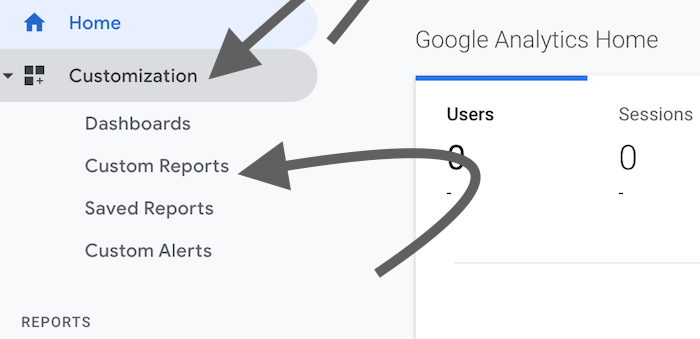
- Click on “+ New Custom Report” to get started
You can name your custom report, as well as each tab you want to create if you want different variables in the same report.
- Choose what you want to create the custom report to report on, including overarching metrics you can choose from a dropdown, more specific dimensions, and filters to fine-tune your data thoroughly.
If you scroll over the question mark in the dropdown, you can learn more about each choice.

- Click on whether you want to see all views or limit them.
Start with all, if you’re not sure. Now click “Save.” You’ll be taken to a page with the data automatically. From here, you can save, export, share, or edit the report.
If you save it, you can find this report under “Saved Reports.”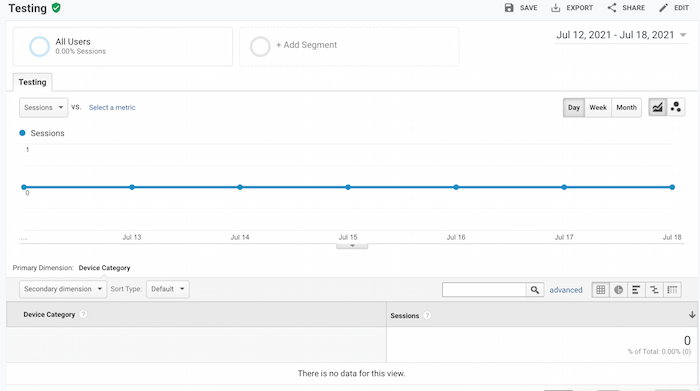
To rerun this custom report, go to “Custom Reports.”
Google Analytics Basics FAQs [wp editor: add schema]
What are some basic things you can do with Google Analytics?
Google Analytics can give you information about who visits your website, how many views your website receives, which content is the most popular, and more.
What is the best way to learn Google Analytics?
You can learn more about the basics of Google Analytics from Google themselves.
What is a Google Analytics tracking code?
Google Analytics uses a tracking ID, which you place in the code of your website or a plugin to allow Google to receive information about your website.
How much does it cost to use Google Analytics?
Most of the benefits of Google Analytics are free, though you can choose to purchase upgrades.
What is the benefit of using Google Analytics?
Google Analytics provides in-depth information on how well your website is performing.
{
“@context”: “https://schema.org”,
“@type”: “FAQPage”,
“mainEntity”: [
{
“@type”: “Question”,
“name”: “What are some basic things you can do with Google Analytics? “,
“acceptedAnswer”: {
“@type”: “Answer”,
“text”: “Google Analytics can give you information about who visits your website, how many views your website receives, which content is the most popular, and more.”
}
}
, {
“@type”: “Question”,
“name”: “What is the best way to learn Google Analytics?”,
“acceptedAnswer”: {
“@type”: “Answer”,
“text”: “You can learn more about the basics of Google Analytics from Google themselves.”
}
}
, {
“@type”: “Question”,
“name”: “What is a Google Analytics tracking code?”,
“acceptedAnswer”: {
“@type”: “Answer”,
“text”: “Google Analytics uses a tracking ID, which you place in the code of your website or a plugin to allow Google to receive information about your website.”
}
}
, {
“@type”: “Question”,
“name”: “How much does it cost to use Google Analytics?”,
“acceptedAnswer”: {
“@type”: “Answer”,
“text”: “Most of the benefits of Google Analytics are free, though you can choose to purchase upgrades.”
}
}
, {
“@type”: “Question”,
“name”: “What is the benefit of using Google Analytics?”,
“acceptedAnswer”: {
“@type”: “Answer”,
“text”: “Google Analytics provides in-depth information on how well your website is performing.”
}
}
]
}
Basics of Google Analytics Conclusion
Google Analytics provides nearly endless amounts of information about your website’s data. Once you set up Google Analytics on your website, you can access metrics covering nearly every part of your customers’ journeys.
You can create custom reports to analyze how well your strategies work. This may help you make informed changes to your website, which may, in turn, draw even more people to your brand and via your analytics-driven marketing strategy.
What’s your favorite Google Analytics feature?
Modern Treasury (YC S18) is hiring our first analytics engineer
Article URL: https://jobs.ashbyhq.com/moderntreasury/640c2aca-5a23-4762-b022-27039bd049cf
Comments URL: https://news.ycombinator.com/item?id=27977599
Points: 1
# Comments: 0
The Muse (YC W12) Is Hiring a Director of Analytics and BI
Article URL: https://www.themuse.com/jobs/themuse/director-of-analytics-business-intelligence Comments URL: https://news.ycombinator.com/item?id=25095586 Points: 1 # Comments: 0 The post The Muse (YC W12) Is Hiring a Director of Analytics and BI appeared first on ROI Credit Builders.
The post The Muse (YC W12) Is Hiring a Director of Analytics and BI first appeared on Online Web Store Site.
The post The Muse (YC W12) Is Hiring a Director of Analytics and BI appeared first on ROI Credit Builders.
The Muse (YC W12) Is Hiring a Director of Analytics and BI
Article URL: https://www.themuse.com/jobs/themuse/director-of-analytics-business-intelligence
Comments URL: https://news.ycombinator.com/item?id=25095586
Points: 1
# Comments: 0
The Muse (YC W12) Is Hiring a Director of Analytics and BI
Article URL: https://www.themuse.com/jobs/themuse/director-of-analytics-business-intelligence Comments URL: https://news.ycombinator.com/item?id=25095586 Points: 1 # Comments: 0 The post The Muse (YC W12) Is Hiring a Director of Analytics and BI appeared first on ROI Credit Builders.
The post The Muse (YC W12) Is Hiring a Director of Analytics and BI first appeared on Online Web Store Site.
The post The Muse (YC W12) Is Hiring a Director of Analytics and BI appeared first on ROI Credit Builders.
7 Instagram Analytics Tools to Grow Your Audience
Instagram is known mostly for engagement. But how do you track it? Let’s cover some Instagram analytic tools you need to be using. Here’s the deal: People love interacting with brands and other individuals. Without engagement, social media doesn’t exist, and engagement matters more on Instagram than most other platforms. In fact, Instagram’s engagement has …
The post 7 Instagram Analytics Tools to Grow Your Audience first appeared on Online Web Store Site.
7 Instagram Analytics Tools to Grow Your Audience
Instagram is known mostly for engagement. But how do you track it? Let’s cover some Instagram analytic tools you need to be using.
Here’s the deal: People love interacting with brands and other individuals. Without engagement, social media doesn’t exist, and engagement matters more on Instagram than most other platforms.
In fact, Instagram’s engagement has been measured anywhere from four to twelve times that of other social channels.
So while you can sell on Instagram, this channel is better known for its benefits at the top of your sales funnel.
The problem with that is your marketing efforts don’t always link back to sales.
That means you’ll have to develop other ways to measure performance to justify all of the time and money spent on Instagram.
So, how do you do it? Luckily, there are a few tools that can help.
I’m going to show you some of the best Instagram analytics tools and why they are worth your time.
1. Owlmetrics
Owlmetrics is basically a one-stop-shop for all things Instagram analytics.
This Instagram analytics tool tracks all of your Instagram account’s key data points, such as follower growth, engagement, hashtag activity, competitor accounts, and click-through rates, while giving you real-time insights in an easy-to-use dashboard.
But that’s not all it can do. It offers a wealth of data beyond Instagram Insights’ underwhelming offerings.
When it comes to tracking engagement, everybody knows that it’s the details that matter.
You’ll get insights on things like the most engaging photo and video filters, top tags by interactions, the best time to post, posts that have received the most engagement, sources of the most engagement, and so much more.
Plus, you’ll be able to keep close tabs on your hashtag performance. Hashtag usage is critical to a good Instagram strategy, so you’ll need to keep a close eye on how they’re benefiting (or hurting) your brand.
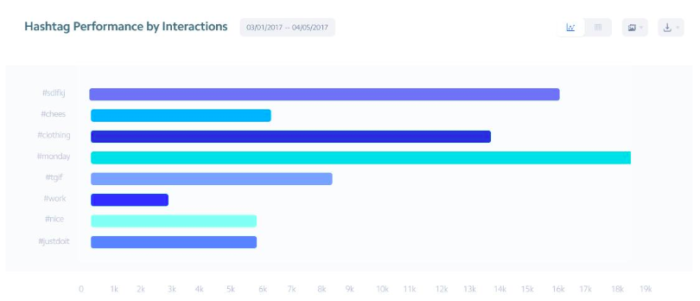
Altogether, their insights generate a goldmine of information for content strategizing. You’ll get daily data regarding your post engagement rates, top posts by engagement rate, and the best-performing types of posts.
With these real-time details at your disposal, you have all the information you need to post dynamite content every day.
You’ll also know exactly where your followers are spending the most time through click rates. You can find your total clicks, average clicks per post, and your clicks change rate.
Of course, the tool shows you these ultra-useful numbers in easily readable graphs, so if you’re not a numbers person, you’ll still be able to see areas of change.
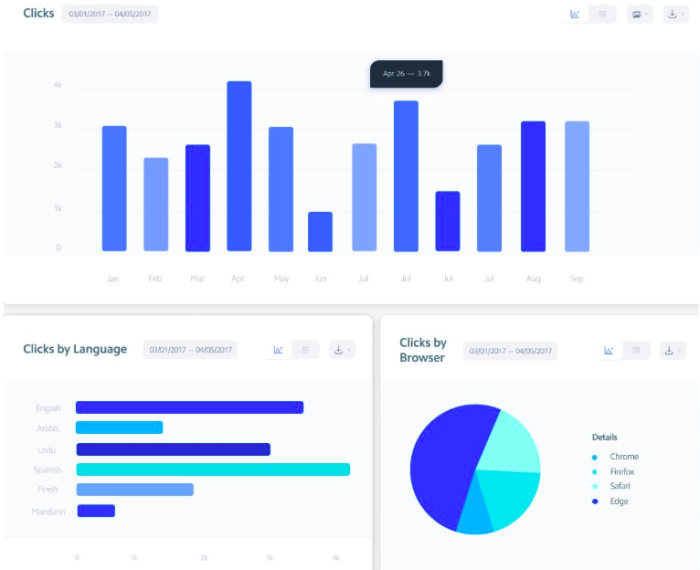
As you can see from these visuals, there’s no shortage of details for your clicks. You’ll see clicks by language, clicks by browser, clicks that are referred from another source, and clicks by location.
All of this contributes to gaining a better, more complete view of your audience.
And since you need an excellent connection with your audience if you want to make it on Instagram, the Owlmetrics audience insights can help you achieve just that.
It gives you all the details regarding your followers, including their age, gender, language, city of origin, and other basic demographics that paint a clearer picture of your audience to help you form better posts.
You also get definitive numbers that help you set and track goals for follower growth. You’ll see your total followers and the growth of total followers.
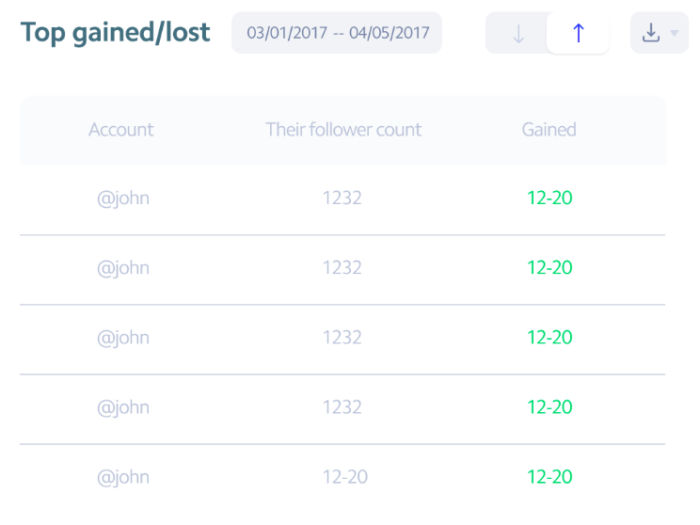
There’s also info about the followers you’ve gained and lost, with insights into your top gained followers and top lost followers. This will help you better curate your content to keep your existing followers and attract even more.
One of the most beloved Owlmetrics’ features is its competitor tracking. You can learn a great deal about executing a quality Instagram marketing strategy by spying on the strengths and weaknesses of multiple competitive Instagram accounts.
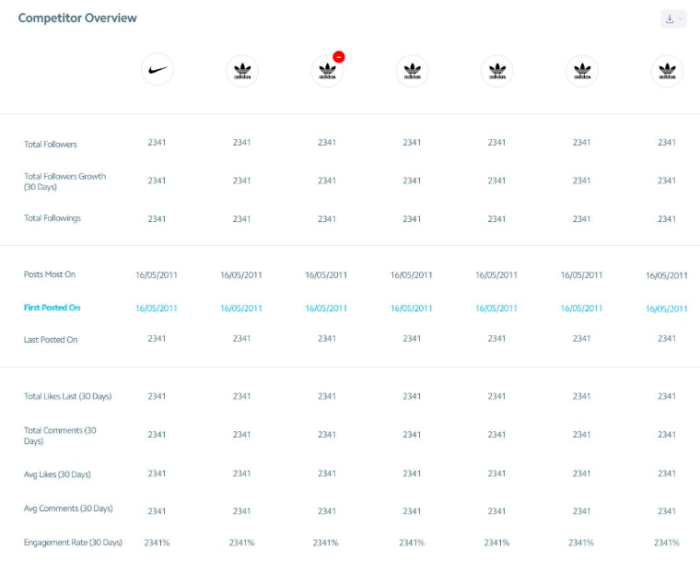
As you can see, it gives you a detailed overview of the Instagram insights for competitors you choose in numbers and graph form.
These insights are updated in real-time, so you’re getting the most accurate numbers for high-performing businesses to compare to your own.
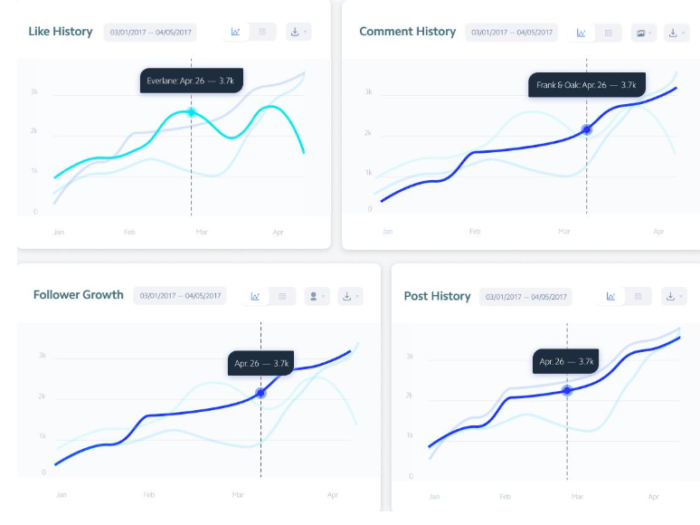
To top it all off, you can schedule exports of any data to CSV, PPTX, and PDF for easier reporting, not to mention it integrates seamlessly into Slack so all your team members can be on the same page.
Your Instagram insights are clear, detailed, collaborative, and always in real-time.
2. Iconosquare
There’s going to be some analytics overlap in a few of these tools.
Iconosquare kicks off by helping you understand how your posting frequency relates to or drives either new followers or lost ones daily.
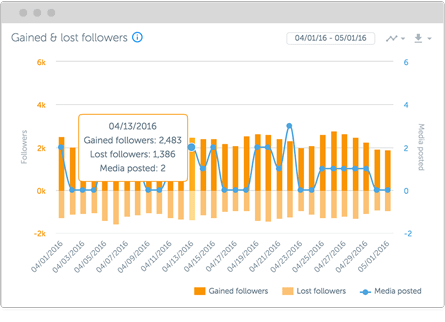
Iconosquare also gives you a Buffer-like tool to manage how you post across several different accounts at one time.
That makes it a perfect tool for freelancers or agencies that want to save time when managing multiple clients (or even multiple departments within the same company) from the same dashboard.
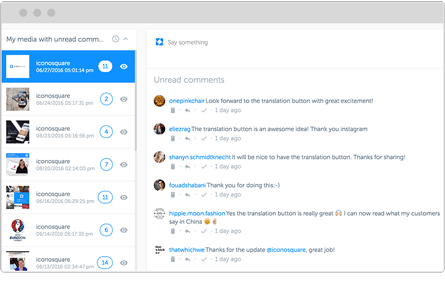
Iconosquare will even show you comments and interactions on each post so you can keep the conversation going without ever leaving.
But that’s not even the best part.
My favorite Iconosquare feature is that they offer a library of awesome content that you can pull from at the ready.
You can quickly search the media library and grab beautiful, high-resolution images to use within seconds.

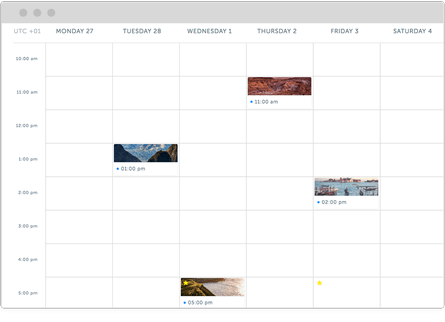
Iconosquare also features an editorial calendar view so that you can schedule posts out ahead of time. It’s easier to manage social media when you plan out content in advance.
Next, you can use it to search for influencers who might help you get the word out about new campaigns and posts.
It will even let you compare influencers based on their own follower and engagement metrics, so you know what you’re dealing with before reaching out to them.
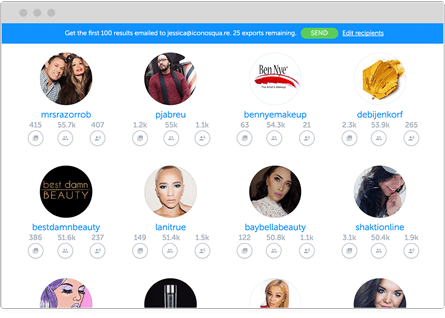
All of this sounds great, right?
But we haven’t even touched on their Instagram analytics yet.
You can measure tags and mentions and get access to in-depth engagement insights.
You can also see how your individual hashtags are performing, view the best days and times to post, and benchmark your engagement rates against the competition.
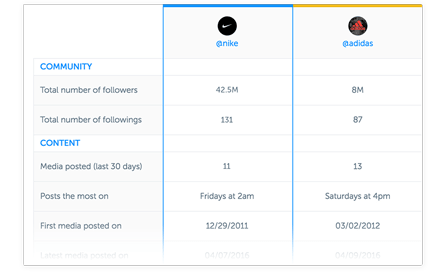
Iconosquare has a 14-day, no credit-card-required free trial. Play around with the analytics before you commit to it with your cash.
3. Sprout Social
Sprout Social is similar to Iconosquare in that it combines Instagram analytics with content creation and management tools. They also have a powerful Instagram analytics platform.
It has a fully-featured editorial calendar for scheduling new content across multiple social account platforms (including Twitter and Facebook).
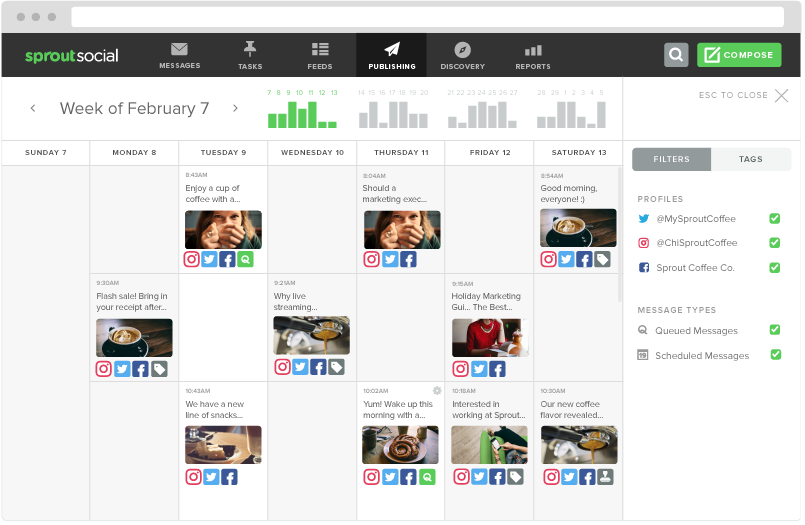
Sprout Social is perfect for larger organizations with rigid guidelines, too, because it has a centralized media library to manage with built-in editing tools.
When a piece of content is ready, you can use the push notification tool to update the person responsible for taking the next step (like moving it from draft to preview and from scheduled to published).
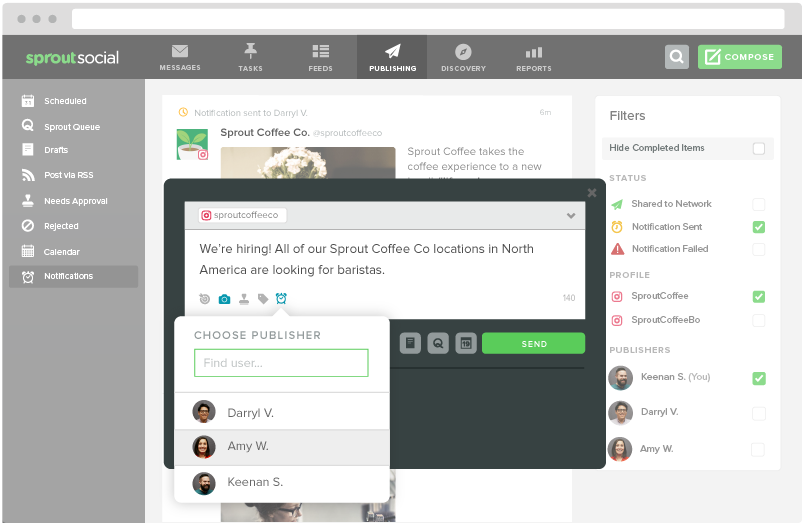
Sprout’s tool set includes a social CRM that will funnel conversations into a central ‘smart’ inbox. Gaining access to this feature can help you boost conversions over time.
You can also dive deeper into individual hashtag performance or even locations that have been geotagged. Pay careful attention to how your performance compares across each.
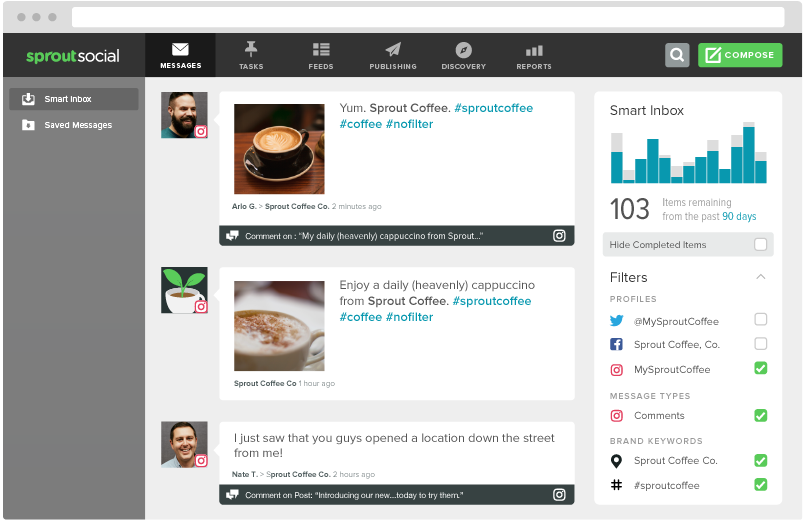
Then you can compile all of this insight into “presentation-ready” reports that can be exported or downloaded by clients and bosses alike.
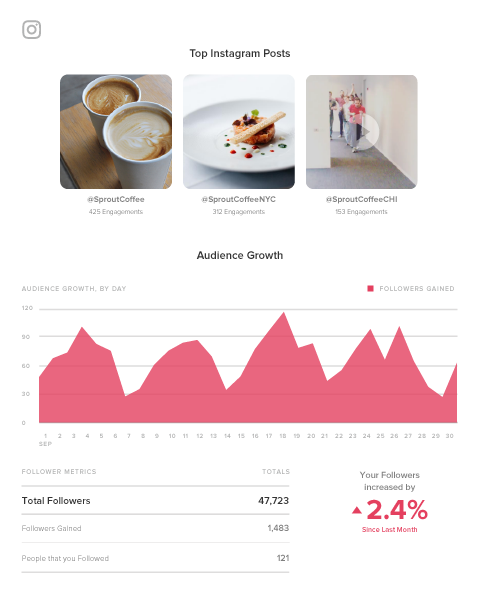
You can also take a spin with the free trial to preview all of these features before paying a single cent.
4. Keyhole
Each Instagram analytics tool we’ve looked at so far will give you daily reporting features. You need those metrics to track your progress.
However, Keyhole prides itself on giving customers real-time feedback. For example, you can drop in a specific hashtag, keyword, or account to see what trends are starting to emerge.
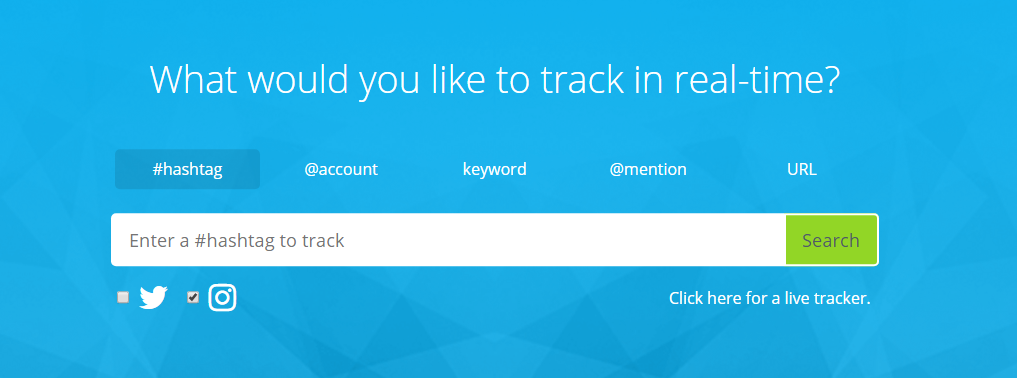
Keyhole will also help you figure out which of your own internal trends provide the best results, giving you at-a-glance data into what activities are driving the most follower growth over time.
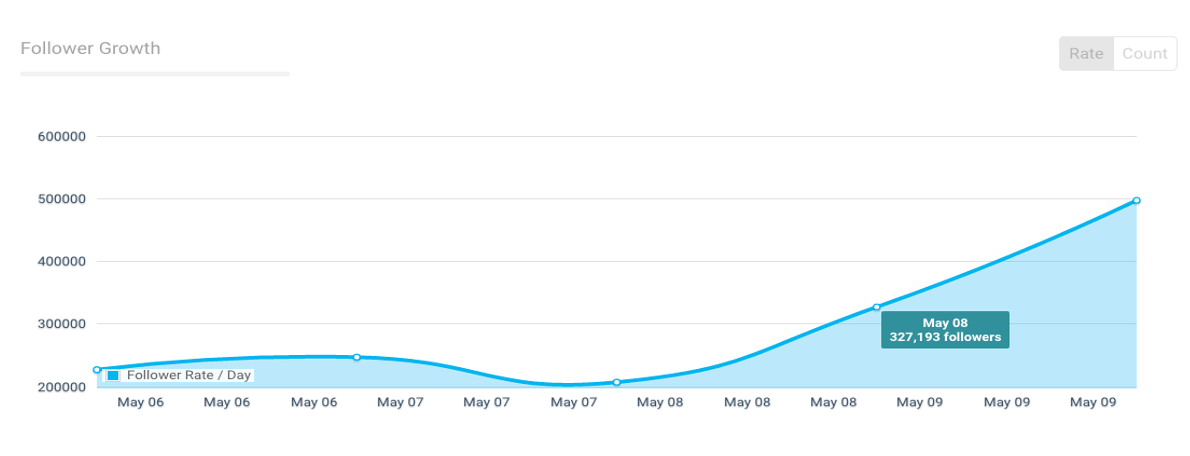
You can also create a feed that will automatically track your competitor’s Instagram accounts to see what’s working for them versus what’s not (then capitalizing on the former while avoiding the latter).
Plus, you can save time by selecting a few predefined KPIs to track. Keyhole will automatically report on those, organizing your data into an easy-to-read dashboard that you can share with team members.
5. SquareLovin
SquareLovin (spelled like McLovin) combines both aggregate data (like overall views and follower counts) with individual metrics on each post (by ‘scoring’ the overall engagement).
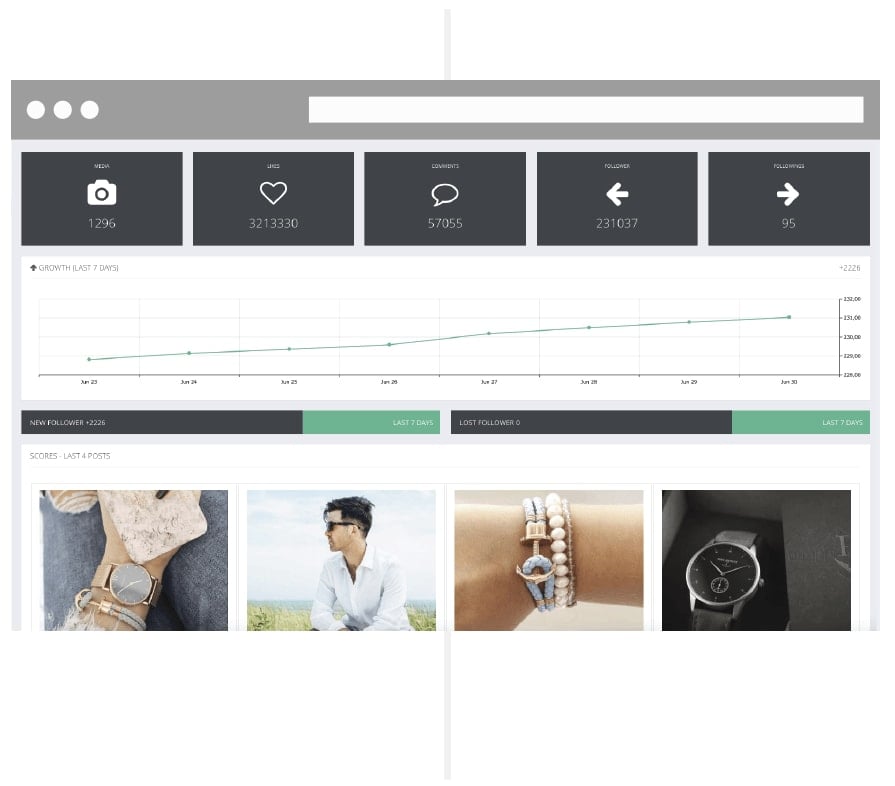
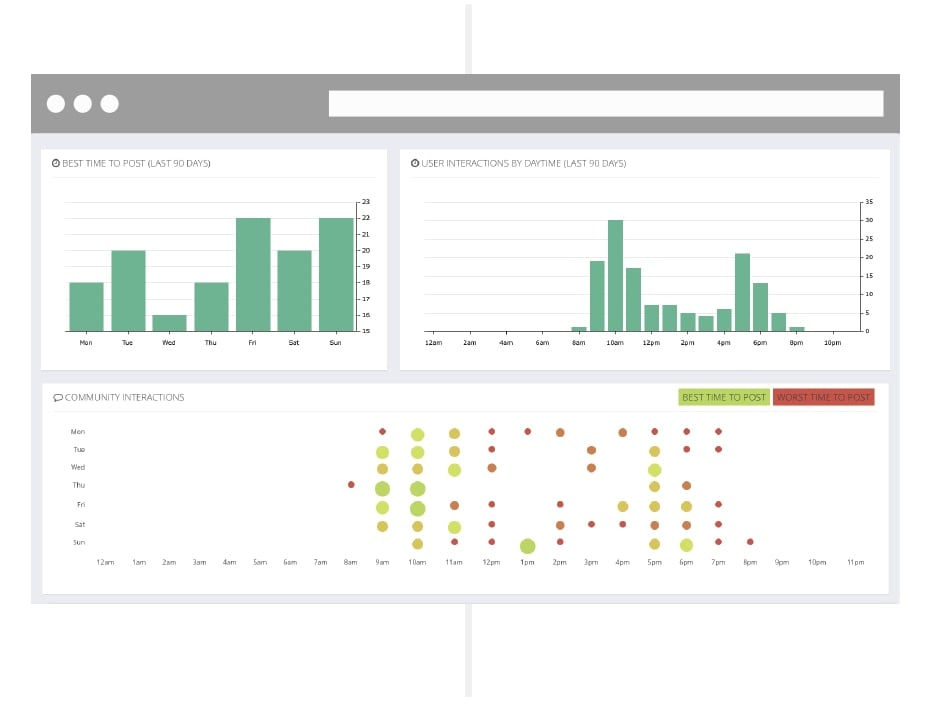
One of my favorite features, though, is the deep dive it gives you into the best-performing times to post.
Like some of the Instagram analytics tools on this list, Keyhole tells you the best time frames for posting based on metrics. However, this tool also explicitly lets you know when you shouldn’t post. This data can be just as valuable, especially if you’re posting all the time.
You might want to constantly test a few of the ‘best’ times to improve performance. However, this way, you’ll always know exactly what hours of the day to avoid like the plague.
6. Minter.io
Many of the Instagram analytics tools already featured give you information about how your Instagram account or your individual posts perform based on your specific KPIs.
Minter.io takes the next step by providing tactical insight into the content decisions you’re making.
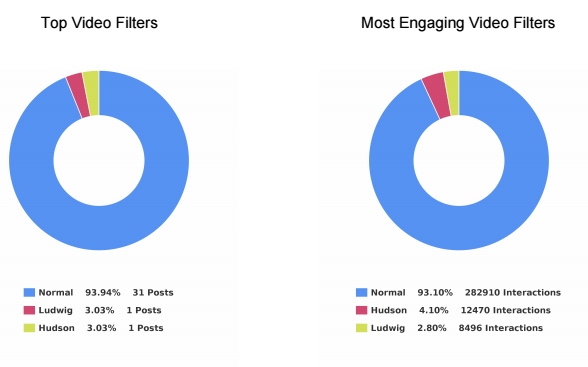
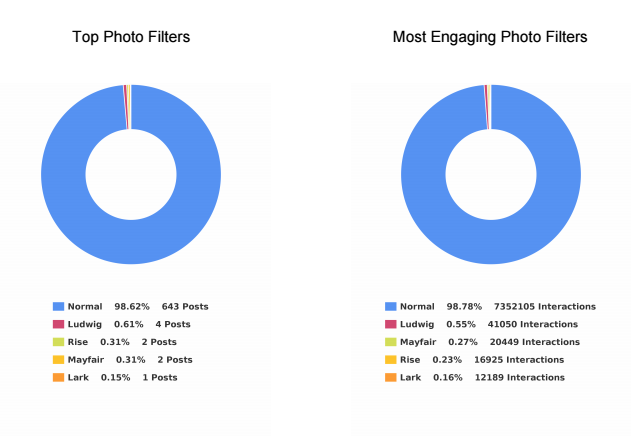
For example, this tool can help you figure out which photo filter performs best among your audience based on a comparison of multiple metrics. Instead of using a single piece of data to decide which filters to use, compare several data points.
I also love how this tool can break down your post engagement into performance rates.
Here’s what I mean.
If you see that you have 1, 10, or even 100 comments on a post, you’re probably pleased with yourself. But when you stop to think about it, there’s not a lot of actionable insight to draw from comment numbers alone.
Let’s say one account has 100 followers, and another has 1,000 followers. Each account gets 10 comments on a single day.
Now, which one is performing better?
The first one, right? That’s because it’s getting a 10% engagement rate on that post instead of only a 1% engagement rate. That makes a huge difference at the end of the day!
Minter.io helps you track these performance metrics over time and create benchmarks to see if your audience’s quality is growing as quickly as the quantity.
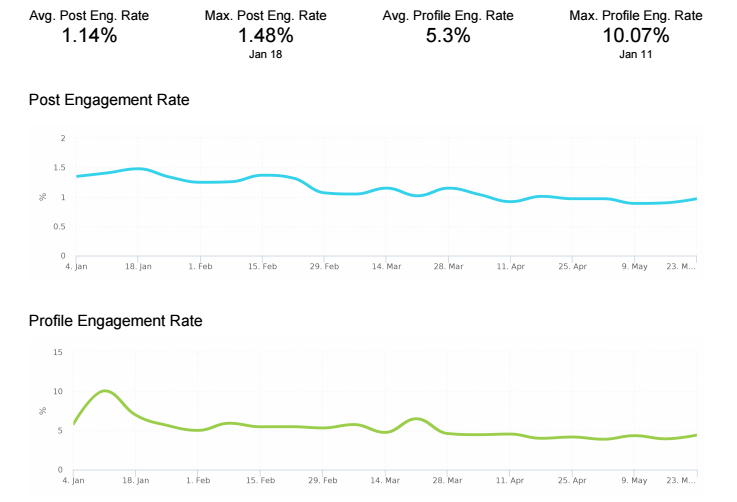
All social platforms use internal algorithms to determine how many of your posts will be seen by your audience.
That means that, if your engagement is low, the social network might artificially ‘restrict’ how many of your own followers end up seeing your content on a given day.
That’s why we constantly talk about the importance of engagement in social media.
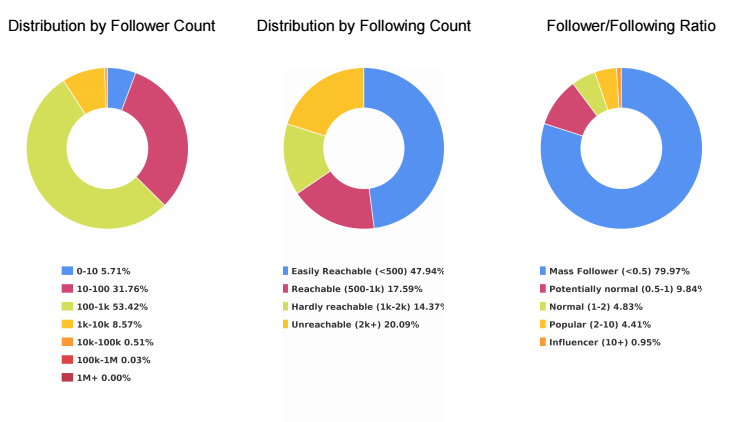
Minter.io will also help you pinpoint big players who are already part of your audience. It’s a great way to identify potential influencers who might amplify your brand message.
For example, followers are split down into several different ‘buckets,’ including:
- Mass Follower
- Potentially Normal
- Normal
- Popular
- Influencer
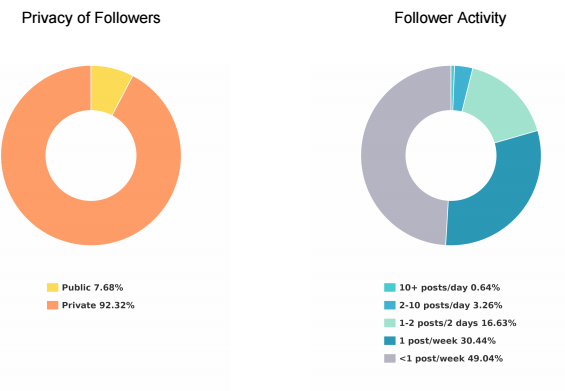
Finally, this Instagram analytics tool also gives you insight into how active your followers are on the platform.
For example, you can see how many posts each of your followers push live each day so that you can mimic the frequency you know your followers are comfortable with.
If you’re only posting twice a day, but the bulk of your audience posts four times per day, you can easily start increasing your posting frequency without fearing any backlash from your community.
7. SocialRank
SocialRank provides detailed audience metrics for both Instagram and Twitter.
Many of the other Instagram analytics tools listed above focus on hard data or your posts’ individual performance metrics.
SocialRank will do some of that, but it’s more concerned with identifying follower patterns so that you can better tailor your content updates to your audience.
That means it will provide details like the most popular words used in your followers’ bios and posts. You can even see the most popular emojis among your target market.
Let’s say you’re trying to find certain types of people, like bloggers or influencers. You can search prospects’ bios based on keywords.
You might also use it for local marketing. Filter your target users by location so you can reach out to potential candidates for local live events and other engagements.
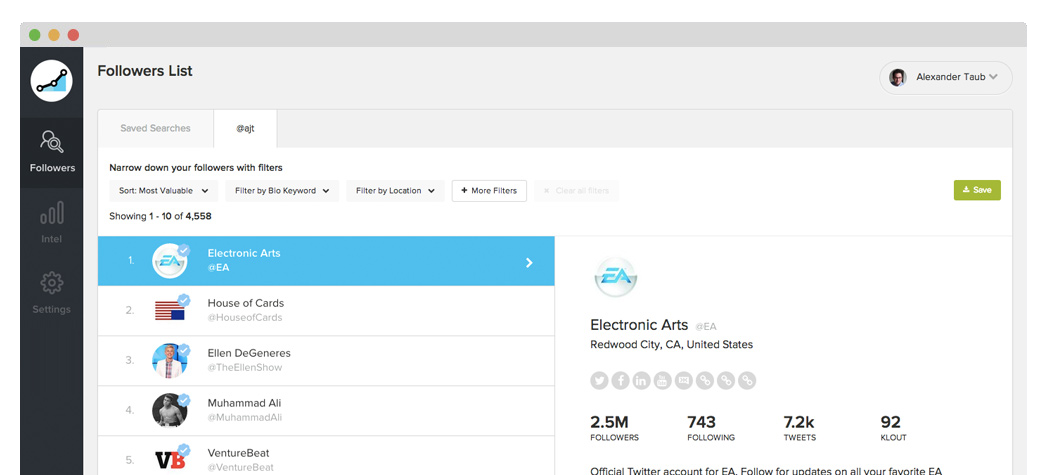
Follower filters help you narrow down the audience into small segments based on some criteria, including the number followers they might have, specific companies, gender, and any combination of those.
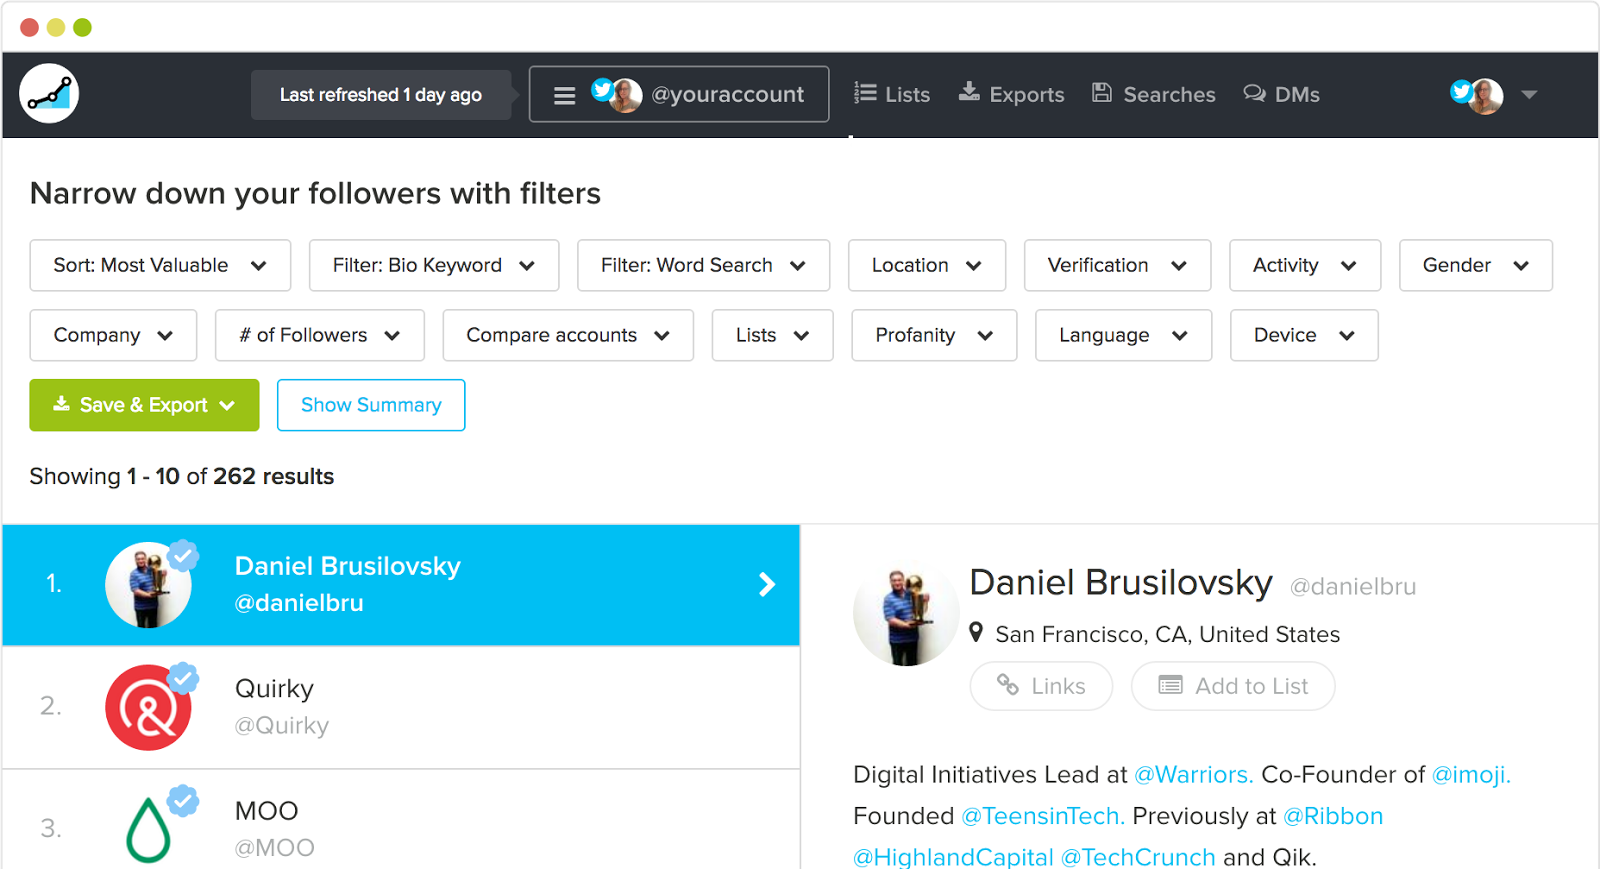
Once you pull up a segment, you can then rank or prioritize these people based on their own engagement with you or their own popularity (by follower count).
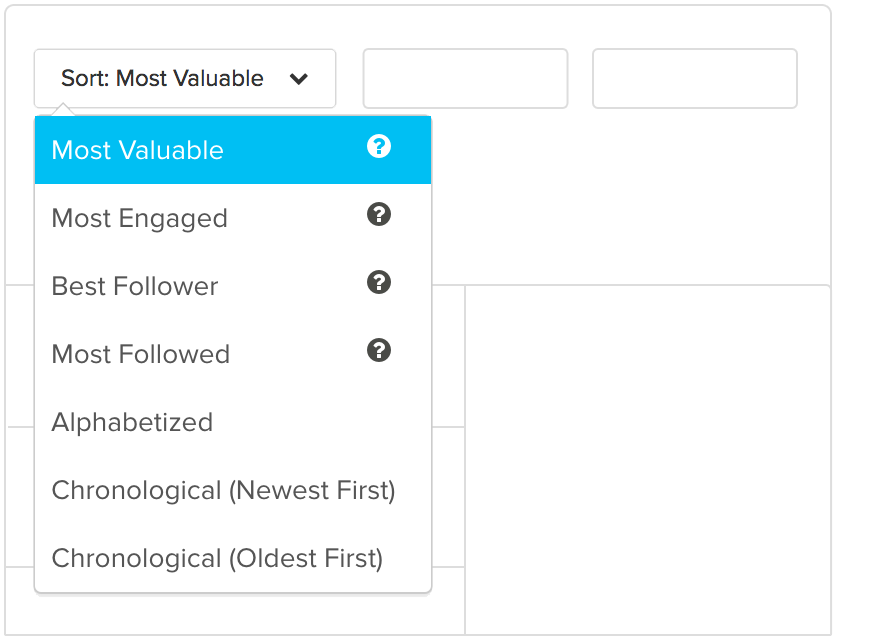
These filters come in handy when you’re trying to pull precise lists of followers.
For example, let’s say you’re opening a new location in a new city (or simply just visiting a new area for an upcoming conference).
You can overlay these filters together to find people who’re using certain hashtags (such as #craftbeer) and located within a specific city (like San Diego).

Then you can pull these follower lists into an Excel or PDF document for easy sharing with your team.

It’s incredibly powerful but not among the cheaper options listed here. I’d recommend using it for larger influencer or PR campaigns. It works best when you need deep audience insight to build buzz around your latest launch.
Conclusion
Social media is fairly simple at the end of the day.
First, you need to understand what your audience wants and is looking for. Second, you need to give it to them consistently.
In reality, it’s a lot tougher than it sounds.
But not if you’re using the right Instagram analytics tools to tell you what your audience is already interested in, talking about publicly, and reacting online.
Instagram is a powerful marketing tool to reach new audiences, increase your brand visibility, and deepen relationships with the people you already know.
Unfortunately, you can’t always track those things back to new Goal completions inside Google Analytics.
They’re ‘soft’ goals used to move people along your sales funnel instead of ‘hard’ goals that result in a new lead or sale.
That doesn’t mean they’re any less important. It simply means that you need to look for different ways to measure progress and results.
While Instagram’s built-in analytics are helpful, the Instagram analytics tools listed here go far beyond those metrics. You’ll be able to quickly identify your target customers, figure out what they’re interested in, and learn how to better serve them with new stuff.
After all, that’s what Instagram analytics tools are for, anyway. Not long, in-depth reporting that takes you hours to compile. You’re often better off with quick insights so that you can take action, update your marketing campaign, and grow faster.
What are your favorite Instagram analytics tools to track metrics?
The post 7 Instagram Analytics Tools to Grow Your Audience appeared first on Neil Patel.
Bounce Rate Analytics: How to Measure, Assess, and Audit to Increase Conversions
Your bounce rate can be such a scary number, right? It’s common knowledge that a high bounce rate is bad, and a low rate is good. Every time you log into your Google Analytics account, it’s right there waiting for you. I understand the feeling when you see that number creeping up. But the problem is …
The post Bounce Rate Analytics: How to Measure, Assess, and Audit to Increase Conversions first appeared on Online Web Store Site.
The post Bounce Rate Analytics: How to Measure, Assess, and Audit to Increase Conversions appeared first on ROI Credit Builders.
Analytics Consulting
Your analytics should tell you everything.
Tools like Google Analytics are incredibly valuable for businesses. Once you’re setup, you’ll have everything you need to analyze your performance data properly. Instead, many companies have realized that their analytics tools have introduced a lot of unexpected problems.
They’re not getting the kind of value they need.
That’s the good news. Most companies think their data is clean; that they’re making good decisions with the data they have. Most of these companies are wrong; they just don’t know it yet. This is why companies need analytics consulting. They don’t know what they don’t know.
Today, I’ll show you how to find the right analytics consultant for your business.
4 Ways an Analytics Consultant Can Help Grow Your Business
Many companies make the wrong assumptions. Using a tool like Google Analytics, clients think all they have to do is drop the tracking code into their web pages, log into their account, and begin analyzing their data. It sounds easy, but it often isn’t.
There’s more to it than that.
This is why you need an analytics consultant. With the right consultant, you’ll have the education you need to grow your business. You’ll be able to pull insights out of your data using a variety of methods. Each of these strategies is important because they have a cumulative effect on your business.
Here are four ways analytics consulting can help you grow your business.
1. Exclude spam traffic via bots, scrapers, and spiders
How much of your traffic comes from real visitors? How much of it comes from bots, scrapers, and spiders? According to Imperva, almost half of all internet traffic is non-human. In 2014, Google introduced an obscure setting that enables you to filter out bots and spiders listed in IAB’s Interactional Spiders and Bots list. This low-key setting is buried in Google Analytics, but it’s incredibly important; many small businesses still aren’t aware of this setting.
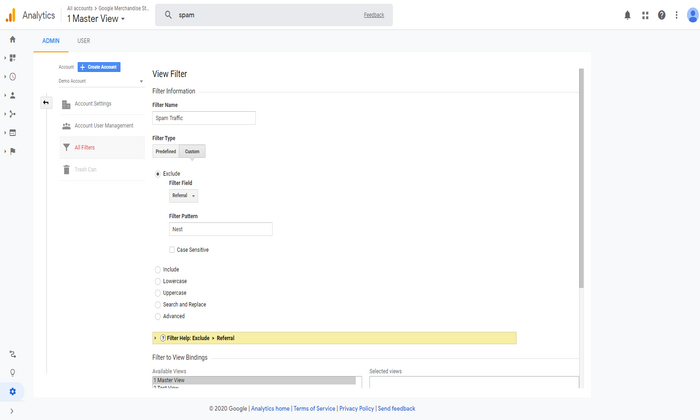
You’ll also need help to filter out referral spam.
Referral spam is basically fake website hits; these bots, scrapers, and spiders land in your site. Site owners send their spam to your site. They hope you’ll see these referrals in your Google Analytics account, clickthrough, and visit their site.
This junk traffic poisons your data.
It gives you false readings based on inaccurate data. Your site may be more or less profitable, depending on your visits-to-spam ratio on your site. This isn’t something many businesses watch for in their analytics reports.
A good analytics consultant will consistently filter the variations of spam traffic (e.g., direct spam traffic, referral spam traffic, etc.) out of your reports, so you get a clear picture of your marketing performance.
2. Help you analyze your data properly
A lot of companies don’t know how to analyze their data properly. According to Forrester, between 60 and 73 percent of a company’s analytics data goes unused. Companies collect lots of data on customer activity, but they aren’t using it, why?
There are lots of reasons.
- Companies don’t know what they have
- Companies aren’t aware of the value of their data
- They don’t know how to evaluate or analyze their data
- Their data isn’t available to those who can use it
- There’s too much data to go through and not enough time to use it

Think about it.
Right now, your company has valuable data about your customers. This is data you can use to attract more customers, lower expenses, grow faster, jump ahead of competitors, etc.
If you’re unaware of the data, you can’t use it.
A good analytics consultant will help you analyze your data properly, showing you what you have and how you can use it to grow your business.
3. Identify the list of problems you’re trying to fix
Your data isn’t as valuable without context.
If you know the problem you’re trying to solve, you have a pretty good idea of the answers you’re looking for in your data.
That’s the problem though.
A lot of companies treat their analytics tools as a technology issue. They focus their attention on the obvious issues like hardware or software. They rarely treat their analytics as a question and answer tool. That’s exactly what it is, though.
Target had the right idea when they started their analysis with a problem/question.
Remember the story?
“If we wanted to figure out if a customer is pregnant, even if she didn’t want us to know, can you do that?” It’s a creepy story that shows the power of questions and problems. A great analytics consultant will help you discover the issues you’re trying to solve and the questions that need answers.
4. Focus your attention on the metrics that explain why
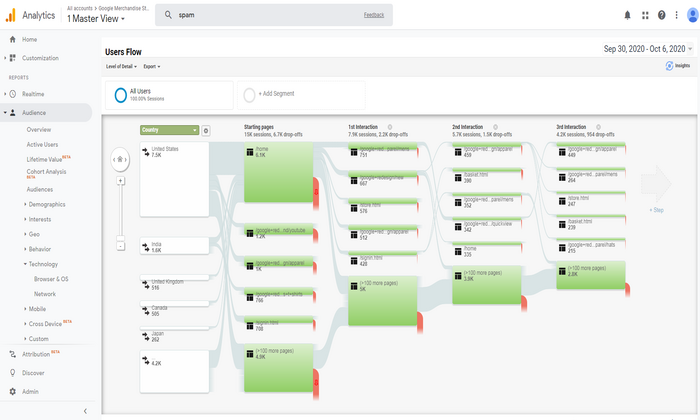
Analytics tells you what happened — what visitors did when they arrived on your site, the ads they responded to, what they read most often, etc. It doesn’t tell you why visitors do the things they do. Understanding what is important, but it’s more important to understand why something happens.
Focusing on the right metrics is the answer.
The right analytics consultant will help you answer the “what” — basically looking in the rearview mirror. But they’ll also help you look ahead; They’ll dig deeper, showing you the why behind visitor and customer behaviors.
Your analytics consultant should provide you with the education and support you need to squeeze more value out of your data.
How to Get Started With an Analytics Consultant
Avinash Kaushik has a three-step framework he uses to help analytics consultants support their clients. He calls it Data Capture. Data Reporting. Data Analysis. The nice part about this framework is the fact that it’s easy for both clients and consultants.
Consultants can use each of these buckets to analyze your goals, objectives, and the results they want to accomplish with each.
You’re basically goal setting with this framework.
Here’s a closer look at each of these three buckets and the goals for each of these.
- Data Capture: Work in this bucket is focused on audits or updating data capture methods (e.g., updating, editing, or customizing tags). This step is especially important because it determines the quality of what comes afterward. If you’ve done a good job with your data capture methods, you’ll have accurate data and reporting you can use for your analysis.
- Data Reporting: Your consultant sets up the reports you need on the intervals required. Your consultants help you identify the reports you’ll need, and they provide you with the reports you need regularly.
- Data Analysis: This is what Avinash calls an open-ended assignment, but it’s one you’ve provided to your consultant. You’re asking them to answer specific questions for you — your consultant should be able to show you what to measure, what your data is saying, what to do based on your data, and why you should do it.
Here’s what this means for you.
You’ll want to find an analytics consultant or agency that can handle all three steps in this framework. This also means you’ll need a clear idea of problems you’re dealing with ahead of time.
Measuring the ROI of Analytics Consulting Services
Many companies don’t understand analytics.
If you don’t understand analytics, that’s okay; you just need to know whether you’re generating a return on your analytics investment. According to Nucleus Research, analytics returns $13.01 for every $1 invested.
Your consultant should be able to calculate your return on analytics investment.
This obviously much easier if your consultant is focused on the data analysis bucket. Suppose they’ve made several data-driven improvements to your site over three to six months. Their recommendations have lead to an increase in revenue, profit, or a return on investment for you. They should be able to verify your return on investment using the worksheet I’ve linked above.
The good news is the fact that analytics, as a discipline, is data-driven.
Checklist For Finding the Right Analytics Consultant
Choosing the right analytics consultant requires a very different set of skills. If you’re working with an independent analytics consultant, you’ll need to approach this in one of two ways.
- Choose a consultant with all of the skills needed to perform across all three buckets (data capture, reporting, analysis).
- Choose an agency with analysts and implementation specialists needed to generate the results you need.
Here’s a list of the skills needed for each of the three roles in your buckets. Avinash breaks these skills down in detail in his web analytics consulting framework post.
Here’s a quick summary.
- For the data capture bucket, your consultant should have the skills of an implementation specialist. They’re experienced with tag managers; they understand data dimensioning and working knowledge of tracking variables.
- With the data reporting bucket, your consultant should be familiar with report creation in your analytics platform; they should also have a master list of the custom reports you’ll need for various options. It’s also ideal if your consultant has a working knowledge of his own set of customizations.
- For the data analysis bucket, your consultant should be a web analyst. Your consultant should be comfortable with advanced statistics and analytical techniques. They should be experienced in descriptive, diagnostic, predictive, and prescriptive analytics.
If you’re working with an independent consultant, they should be an industry veteran with the skills I’ve listed above. If you’re working with an agency, they should have employees with the skills for each bucket. If you have implementation specialists, you can handle data capture and possibly reporting.
Just make sure they’re a fit for that role.
Conclusion
Many companies aren’t familiar with analytics consulting. They’re not entirely sure how analytics impacts their organization. That’s okay, as long as the ROI is there.
Using a tool like Google Analytics, many companies assume that all they need to do is customize the tracking code, drop it onto their web pages, log into their account, and begin analyzing their data. It should be that easy, but it isn’t.
There’s more to it than that.
With most companies, their analytics data goes unused, they collect lots of data on customer activity, but they don’t know how to squeeze value out of their data. Analytics consulting can help you evaluate your performance data properly. Choose the right team, and your data will tell you what you need to know.
The post Analytics Consulting appeared first on Neil Patel.


